Original articles
EFFECT OF IONIC STRENGTH IN LOW SALINITY WATER INJECTION PROCESSES
EFECTO DE LA FUERZA IÓNICA EN PROCESOS DE INYECCIÓN DE AGUA DE BAJA SALINIDAD
EFFECT OF IONIC STRENGTH IN LOW SALINITY WATER INJECTION PROCESSES
CT&F - Ciencia, Tecnología y Futuro, vol. 10, no. 2, pp. 17-26, 2020
Instituto Colombiano del Petróleo (ICP) - ECOPETROL S.A.
Received: 07 August 2020
Revised document received: 02 September 2020
Accepted: 28 September 2020
ABSTRACT: Low salinity water injection has been frequently studied as an enhanced oil recovery process (EOR), mainly due to promising experimental results and because operational needs are not very different from those of the conventional water injection. However, there is no agreement on the mechanisms involved in increasing the displacement of crude oil, except for the effects of wettability changes. Water injection is the oil recovery method mostly used, and considering the characteristics of Colombian oil fields, this study analyses the effect of modifying the ionic composition of the waters involved in the process, starting from the concept of ionic strength (IS) in sandstone type rocks.
The experimental plan for this research includes the evaluation of spontaneous imbibition (SI), contact angles, and displacement efficiencies in Berea core plugs. Interfacial tension and pH measurements were also carried out. The initial scenario consists in formation water (FW), with total concentration of 9,800 ppm (TDS) (IS ~ 0.17) and a 27 °API crude oil. Magnesium and Calcium brine were also used in a first approach to assess the effect of the divalent ions.
Displacement efficiency tests are performed using IS of 0.17, 0.08, and 0.05, as secondary and tertiary oil recovery and the recovery of oil increases in both scenarios. Spontaneous imbibition curves and contact angle measurements show variations as a function of the ionic strength, validating the displacement efficiencies. Interfacial tension and pH collected data evidence that fluid/fluid interactions occur due to ionic strength modifications. However, as per the conditions of this research, fluid/fluid mechanisms are not as determining as fluid/rock
KEYWORDS: Low salinity, Ionic strength, Wettability, Spontaneous imbibition, Contact angle, Core flooding.
RESUMEN: La inyección de agua de baja salinidad ha sido frecuentemente estudiada como un proceso de recobro mejorado (EOR), principalmente debido a resultados experimentales prometedores y dado que las necesidades operacionales no son muy diferentes a las de la inyección de agua convencional. Sin embargo, no existe consenso en los mecanismos por los cuales mejora el desplazamiento de aceite, solo en que está relacionado con un efecto en la humectabilidad. La inyección de agua es el método de recobro más utilizado y, considerando las características de los campos Colombianos, este estudio analiza el efecto de modificar la composición iónica de las aguas involucradas en dicho proceso; partiendo del concepto de fuerza iónica (FI) y para rocas tipo areniscas.
El diseño experimental para esta investigación incluye la evaluación de imbibiciones espontáneas (IS), ángulos de contacto y eficiencias de desplazamiento en rocas tipo Berea. También se considera la variación de la tensión interfacial y el pH. El sistema inicial se construyó con agua de formación con concentración total de 9.800 ppm (TDS) (FI ~ 0.17) y crudo de 27 °API. Salmueras de cloruro de Calcio y Magnesio también fueron utilizadas para evaluar el efecto de los iones divalentes.
Pruebas de eficiencia de desplazamiento fueron realizadas con agua de fuerza iónica de 0.17, 0.08 y 0.05, en escenarios de recobro secundario y terciario, presentando aumento de la recuperación de aceite en ambos casos. Las mediciones de imbibición espontánea y de ángulos de contacto presentaron variación con la fuerza iónica, validando los resultados de eficiencia de desplazamiento. Las mediciones de tensión interfacial y pH indican interacciones fluido-fluido debidas al cambio en la fuerza iónica, sin embargo; para las condiciones de esta investigación, los mecanismos fluido-fluido no parecen tan determinantes como los fluido-roca.
PALABRAS CLAVE: Baja salinidad, Fuerza iónica, Humectabilidad, Imbibición espontánea, Ángulo de contacto, Eficiencia de desplazamiento.
1. INTRODUCTION
Water injection with modified salinity is an emerging EOR technique where the chemistry of the water/brine/rock system plays a fundamental role in oil recovery. Due to the complex nature of these interaction, different mechanisms have been proposed to explain how the low salinity water injection can improve oil displacement [1],[2],[3],[4].
Rock wettability changes represent the main mechanism proposed to explain the effects of low salinity water injection. Different authors indicate that a modified (low) salinity generates alteration of this property releasing oil drops stuck to the rock surface (clay minerals) Alexander Rock [5] concludes that wettability alteration is the most relevant recovery mechanism, followed by fine migration while multi-component ion exchange double-layer expansion is Less crucial. Ligthelm [6], in experimental research for sandstones, suggests that a reduction in the ionic strength of the brines generates a multi cation exchange that alters wettability and increases displacement efficiency. Vledder [7] shows, at reservoir scale, that low salinity water injection produces a wettability change and a higher oil recovery. Berg [8] provided experimental evidence that the emulsion generation, fines migration, and decrease in interfacial tension are not relevant. Conversely, this study concluded that wettability alteration by double-layer expansion and cation exchange represents the dominant microscopic mechanism in low salinity water injection. Mamonov [9], argues that, although in the Literature wettability is one of the most important mechanisms, it depends on the adsorption of compounds from the heavy fractions of crude oil. It is complex to establish the reservoir's wettability as it implies chemical interaction with rock minerals, formation water, and surfactant compounds from crude oil. Most of the mechanisms proposed to explain the effects of low salinity water injection are based on the presence of clays, polar compounds in the oil, and divalent ions in the involved brines.
Wettability alteration of the reservoir rock due to the interactions with brine and/or oil is a critical variable that still needs further understanding of the proper development of modified water injection. Interaction between water and oil could also generate wettability changes as it can produce the release of oil or water content form the rock. At a pore-scale, wettability defines the trajectories of oil and brine, as well as the phase that covers the rock surface and the capillary pressure curves that determine the pore volume distribution of fluids [10], Spontaneous imbibition tests are a well-known method to evaluate reservoir rock wettability [4] However, its static character makes it necessary to consider some other measurements to quantify the wettability tendency and the recovered oil [1], where displacement tests in porous media are essential.
This research delves into whether modified salinity water is more effective than reservoir brine in the oil recovery of a Colombian field Therefore, core flooding tests were carried out using formation water and the same water with different degrees of salinity dilution (ionic strength), measuring pressure profiles, effective oil permeabilities, and displacement efficiency. Spontaneous imbibition and contact angle tests were conducted to understand possible wettability changes. Interfacial tension and pH data were also gathered Additionally, the same ionic strength is considered with equivalent brines of calcium and magnesium ions to evaluate their influence in the fluid:rock assessed systems.
2. EXPERIMENTAL DEVELOPMENT
FLUIDS CHARACTERIZATION
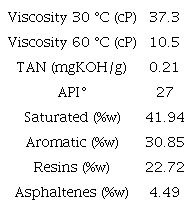
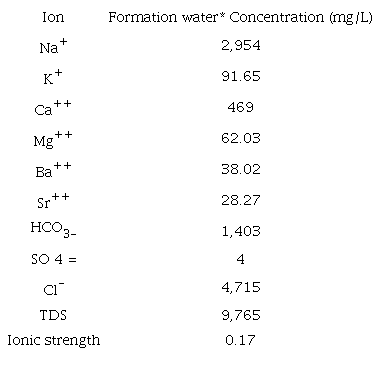
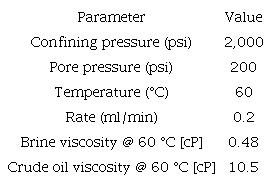
This study considers a 27 ° API Colombian crude oil with 10.5 cP @ 60 °C. Oil properties are shown in Table 1. The basic number (BN) was not reported in this study; however, recent research has shown its importance in sandstones [9], Table 2 corresponds to the characterization of the formation brine (FBI) used for the tests, with an approximate concentration of total dissolved solids (TDS) of 9,800 ppm and IS of 0.17 (IS=0,17= 0,17 M NaCl). This brine is diluted in different proportions until reaching IS 0.08 (FB2) and IS 0.05 (FB3) Additionally, synthetic CaCl2 and MgCl2 brines were prepared in concentrations that allow having the IS of FBI and FB2, respectively. All the brines were prepared using reactive grade Merck products.
*FB2 and FB3 are dilutions of this same brine in percentages of 50 and 70%, respectively.
ROCK CHARACTERIZATION
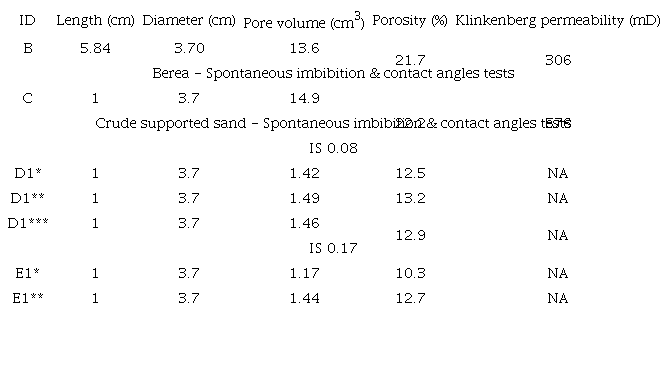
Berea rock samples were used for core flooding, spontaneous imbibition, and contact angle tests, using reservoir fluids of the field being evaluated. Furthermore, spontaneous imbibition and contact angle tests were also carried out using crude oil supported unconsolidated Ottawa sand (0.8 g oil /12 g sand), and reservoir fluids and Calcium and Magnesium synthetic brine. The details of the porous media are shown in Table 3.
The characterization of the Berea elemental and mineralogical composition was carried out using a QUANTA™electronic microscope, coupled with an X-ray system using scattered energy (SEM-EDS) The results (Figure 1) show a quartz composition with frequent clear pores and some clay minerals like Kaolinite in loose sheets and grouped between the pores and lllite on the grains and at its edges.
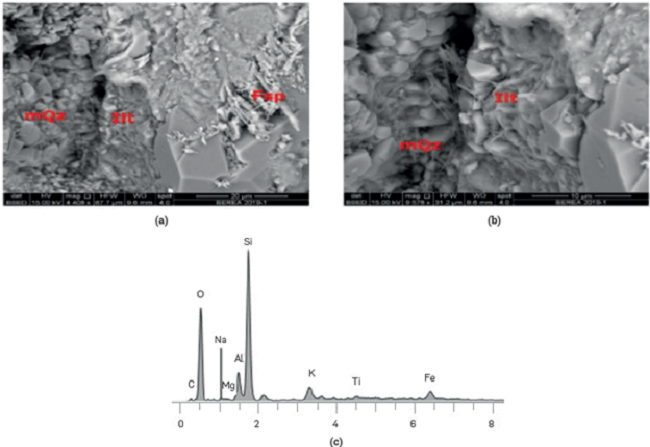
Figure 1
Images and elemental composition of the Berea. Quartz with some clay minerals (Kaolinite and lllite) Electron Microscopy Laboratory. Centro de Innovación y Tecnología, I.CP.
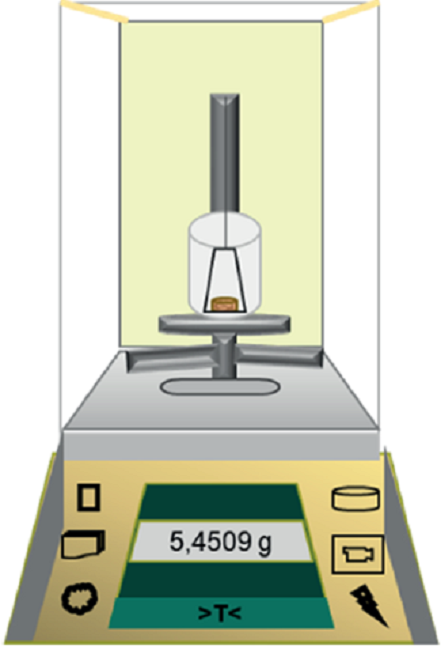
Figure 2
Analytical balance for the spontaneous imbibition tests.
METHODS
STATIC TESTS - SPONTANEOUS IMBIBITION, CONTACT ANGLES, INTERFACIAL TENSIONS
Spontaneous imbibition. To assess changes in the wettability of the mineral surfaces, the Berea sandstone, and the crude supported sand samples are contacted with the crude oil and the brines.
For the Berea case, the contact times of the fluids with the sample are the same as for the core flooding displacements. Three stages were carried out: (i) rock in formation brine FB1, FB2, and FB3; (ii) rock in crude oil; and (iii) rock in the same formation brine of stage (i). For the crude supported sand samples, three stages were also executed, which are described as follows, (i) the rock is in contact with brine FB1; (ii) rock in crude oil; and (iii) the rock samples are in contact with synthetic Ca2+, Mg2+ or Ca2+ + Mg2+ brine. The contact times are controlled using the behavior of the weight curve for every sample. All tests were performed at a temperature of 30°C.
Throughout the exposition times of the samples in the fluids, the change in weight is observed using an analytical balance (Figure 2). The data is reported in a time vs. sample weight change plot, where mi is the initial weight in time i, and mi+1 is the gained weight in time i+1.
Contact angle. Contact angles are a quantitative measurement of wettability on the surface at a specific point. The results are obtained suspending a drop of the studied fluid at a representative point of the rock surface, and it is executed at the end of every spontaneous imbibition stage. The equipment used for this test is an optical tensiometer OCA 25 (OCA 25 PMC 750). In every angle measurement, two values are considered, right angle and left angle of the drop on the surface. The drop volume in this study is 15μ L. Once the drop is on the surface, a lens captures the image, which is processed in the equipment software. The forms obtained are analyzed considering the pendant drop and the sessile drop method. Figure 3 is the schematic of the compactor equipment used to build the crude oil supported sand samples. Figure 4 shows the representation of the optical tensiometer for contact angle measurements used in this study.
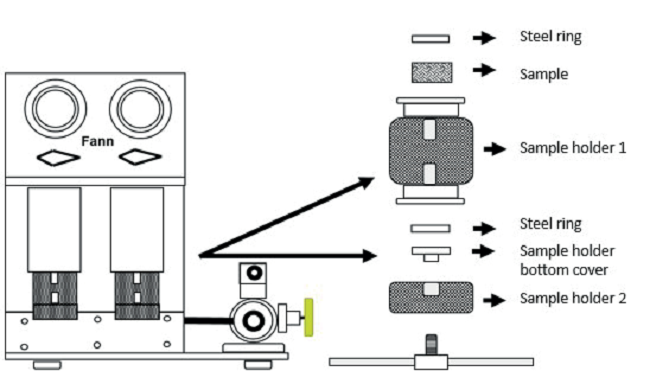
Figure 3
Fann compactor for preparing crude oil supported sand samples. Cements and drilling fluids laboratory. Centro de Innovación y Tecnología, I.C.P.
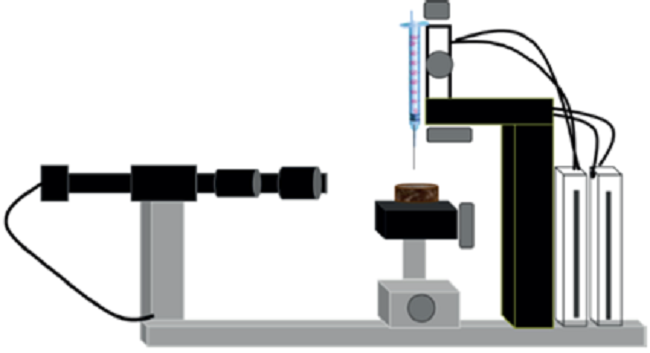
Figure 4
Representation of the optical tensiometer equipment (OCA 25 PMC 750) for contact angle measurement. Production chemistry laboratory. Centro de Innovación y Tecnología, I.C.P.
Interfacial tension. The interfacial tension between crude oil and brines was obtained using the Du Noüy ring method.
CORE FLOODING - SECONDARY AND TERTIARY OIL RECOVERY - DISPLACEMENT EFFICIENCIES
Displacement efficiency in porous media. The core flooding tests consisted of an oil recovery evaluation in secondary and tertiary mode. In the first case, approximately six pore volumes (PV) of brine were injected to obtain the absolute permeability of the system. Then, the crude oil was injected to find the oil effective permeability to irreducible water saturation (Koe @ Swir). Once the pressure drop is stable, FB1 (IS = 0.17) is injected to run the displacement efficiency. When the oil production ends, and the pressure drop is steady again, the effective water permeability to residual oil saturation is obtained (Kwe @ Sor). At this point, the system is resaturated with oil (Koe @ Swir) to perform the displacement efficiency with FB2 (IS = 0.08) and FB3 (IS = 0.05) brines, respectively.
For the tertiary oil recovery evaluation, FB1 (IS = 0.17) is injected until Sor (Sor @ FB1), then FB2 (IS = 0.08) is injected until a new Sor is reached (Sor @ FB2) and, finally, the injection of FB3 (IS = 0.05) is performed until no more oil is produced. Figure 5 shows an outline of the core flooding equipment.
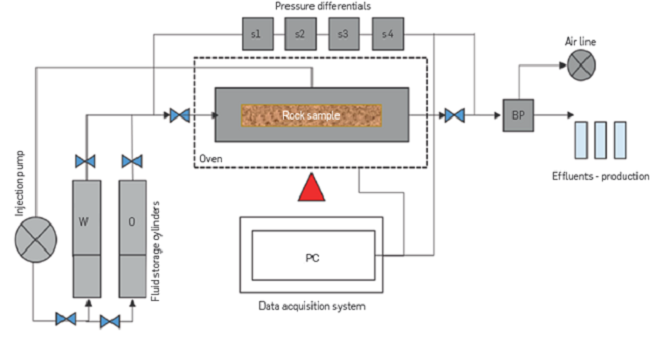
Figure 5
Core flooding equipment outline.
3. RESULTS
EFFECT OF THE IONIC STRENGTH CHANGE IN THE AQUEOUS PHASE
For analyzing the impact of the water injection ionic strength in modified salinity water injection processes, formation water (FB1) is injected with a total dissolved solids concentration (TDS) of 9,800 ppm and IS 0.17. The approach used to assess the effects of the IS was to dilute the initial brine of IS 0.17 (FB1) with distilled water to generate lower salinity brines FB2 (IS = 0.08) and FB3 (IS = 0.05), respectively.
CORE FLOODING - SECONDARY AND TERTIARY OIL RECOVERY - DISPLACEMENT EFFICIENCIES
Table 4 shows the test conditions for the displacement efficiency measurements of water with different ionic strengths.
Formation water injection presents an absolute permeability of 135.5 mD, 55.7% less than the original Klinkenberg permeability. Next, crude oil is injected, obtaining an effective oil permeability (Koe @ Swir) of 86.23 mD. At this moment, the first displacement efficiency is developed using FB1. Once the system reaches residual oil saturation conditions (Sor @ FB1), FB2 is injected until reaching the new Sor (Sor @ FB2). At this point, the lower salinity brine (FB3) is injected until no more oil is produced. The oil production response is reported as a function of the injected pore volume (IPV) of each brine.
After injecting FB2 brineat So @ FB1, an additional 9% of oil is produced, which means that a reduction of approximately 50% in the ionic strength can increase oil mobility as a tertiary recovery method. However, a further decrease (From 0.08 to 0.05) of the ionic strength does not result in additional oil production (Figure 6). This behavior is possibly due to a charge redistribution at the mineral surface, preferring the low ionic strength water cations, and releasing oil drops attached by polar interaction [11],[12],[13]. The pressure drop observed is characteristic of coreflood water injection processes, stabilizing and reaching its lowest point when only one phase is flowing (FB3).
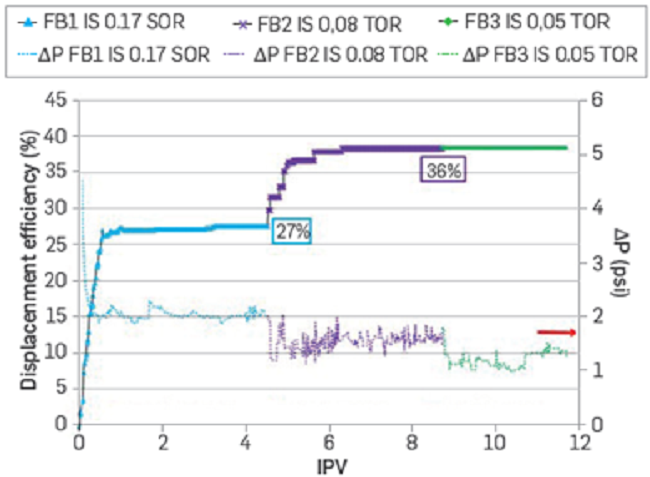
Figure 6
Displacement efficiency as tertiary oil recovery for FB1, FB2, and FB3 (rock samples B). (SOR) Secondary Oil recovery, (TOR) Tertiary Oil Recovery.
For assessing the displacement efficiency as a secondary recovery process with FB2 and FB3 brines, the sample is saturated with crude oil before each water injection, obtaining, for example, the effective oil permeabilities (Koe1, Koe2, and Koe3) for each of the waterfloods (Figure 7) The Koe values obtained indicate an increase in the flow capacity when a reduction in ionic strength occurs. The high residual water saturation values are attributed to changes in salinity (IS) considered in the experimental protocol. These results are also consistent with the spontaneous emulsification observed with the crude oil used in this study [14], as it will be briefly discussed later in this section.
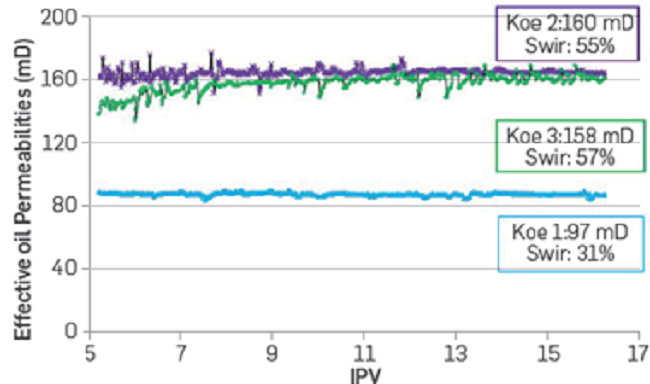
Figure 7
Effective oil permeabilities after injection of FB1, FB2, and FB3. Sample B in Table 3.
When FB1 is injected as secondary oil recovery, a displacement efficiency of 27% is obtained (Figure 8). Next, crude oil is injected to saturate the system again until reaching similar Swir. It is worth mentioning that prior to this experiment, the porous media was at residual oil saturation with FB3 brine from the tertiary recovery evaluation. Then, the FB2 brine was injected, and the displacement efficiency improved by 9%. Finally, the core plug is resaturated with oil until reaching Swir to begin injecting FB3 brine (IS = 0.05). The displacement efficiency observed in this experiment was 24% and 15% higher than those recorded injecting FB1 (IS = 0.17) and FB2 (IS = 0.08), respectively (Figure 8). These results suggest that a decrease in salinity (IS) in the Berea coreflood using the crude oil under evaluation improves the displacement efficiencies regardless of the higher Swir at the beginning of the test injecting FB2 and FB3 (Figure 7). As already mentioned, the crude oil used in this study shows a natural tendency to form a microdispersion with decreased water salinity (IS) [14]. The latter can explain the increase in Swi observed when resaturating the Berea core plug with reservoir oil in the presence of high water saturation (Sorw) at lower IS. Although these experiments might not be comparable due to the effects of oil:water interactions, it is clear that oil can be recovered by decreasing water salinity. Hence, a new set of corefloods is underway considering a different oil resaturation approach. For example, the updated protocol considers the injection of FB1 brine after every experiment until no salinity changes are observed before the oil saturation stage. However, the results of these experiments are beyond the scope of this paper.
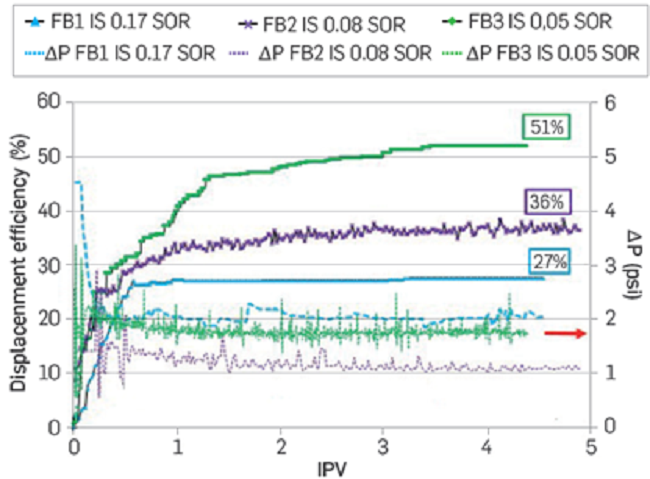
Figure 8
Displacement efficiency of real brine with different ionic strengths. Sample B in Table 3. Secondary oil recovery (SOR).
The effluents at the end of every secondary recovery stage were collected and maintained in a temperature control environment to measure pH (@25°C), as shown in Figure 9. In general, the changes in pH recorded during the three corefloods were relatively small (<0.6) and varied depending on the IS strategy. The most considerable pH change was obtained after flowing FB3, which is the experiment with the higher displacement efficiency observed at Swi (Figure 8). These results indicate that there is variation of pH with the different displacement efficiency stages. These results are consistent with different studies that show the relation between pH and low salinity effects [15]. However, the effect of changes in pH still requires further research.
The pH increase is attributed to the presence of clays in the rock, generating a possible cations exchange with the injected water [16] [17]. When brine with lower ionic strength is injected, the mineral surface may have exhausted its full capacity of ion exchange, withonly free cations been exposed.
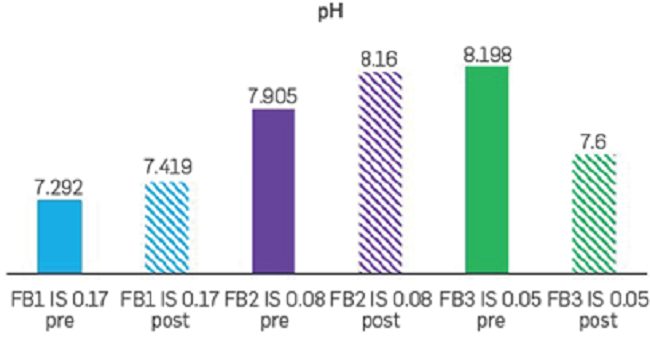
Figure 9
pH values (@25°C) before and after the injection of FB1, FB2, and FB3 brine.
The crude oil used in this study has a low TAN (0.2). Although the generation of natural surfactants from residual oil (saponification) seems unlikely, the higher differential pressures and Swir observed with lower IS brines (FB2 and FB3) suggest some type of oil:water interactions. Hence, large variations in pH were not observed to justify it as a possible recovery mechanism [18]. The potential formation of natural surfactants can reduce the water-oil interfacial tension (IFT) and make the rock more water wet [19]. However, in these experiments, IFT changes were minor, as discussed later in this paper. Some authors, Rezaei Doust et al. [20], have reported successful core flooding tests using low salinity in low TAN oil. On the other hand, some authors have not found a relation between the pH of the effluents and the low salinity injection [21].
The data collected, for the conditions of this research, does not allow for establishing the pH as a dominant oil recovery mechanism.
IMBIBITION CURVES, CONTACT ANGLES, AND INTERFACIAL TENSION
According to the results of displacements, for the construction of spontaneous imbibition curves, two scenarios are established. The first one corresponds to consolidated rocks (sample C in Table 3), with the same fluids and contact times. The second scenario uses crude oil supported sand samples (D and E in Table 3), although analyzing the effect of divalent cations (Ca2+ and Mg2+) separately in the brines with IS of 0.08 and 0.17. In the tertiary recovery mode, these values presented a more substantial influence (Figure 6).
Consolidated samples: Figure 10 presents the saturation curves for the different samples. In a period of 25 hours, the porous media gain weight in the same proportion, suggesting that for all the ionic strength tested, the saturation process has the same behavior (Figure 10a). Subsequently, the rocks get in contact with crude oil, and as the curves have normalized values, it is possible to compare the behavior as a function of time (Figure 10b). The rock that gains more weight in this stage is for the FB3 brine (IS 0.05), which suggests that when the initial system has lower IS, it is more oil-wet.
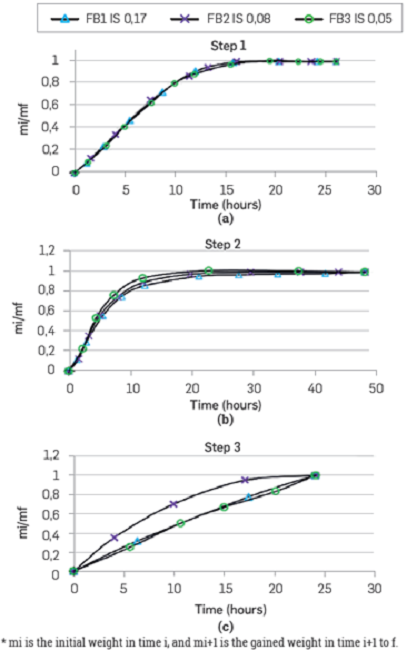
Figure 10
Spontaneous imbibition tests. IS 0.17, 0.08, and 0.05.
The porous media saturated with oil are put in contact again with the same brine (Figure 10c). The sample that gains more weight faster corresponds to the FB2 brine, with a dilution equivalent of 50% vs the original brine FBI. This behavior shows that this ionic strength, 0.08, will have the best oil displacement when the rock is at irreducible saturation of the same water. This result is consistent with the displacement efficiency observed during the tertiary mode coreflood shown in Figure 6.
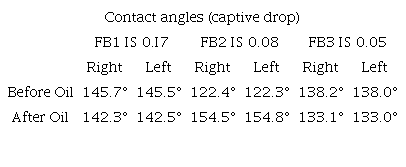
The results described above are complemented with contact angle measurements before and after the contact with oil, using the captive drop method (Table 5). It can be noticed that the system that gains more weight (FB2) coincides with a more significant change in the contact angle, which means the less oil-wet tendency.
Unconsolidated samples: For this evaluation, the study was divided into two groups based on the IS of the divalent cation chloride solutions (CaCl2 and MgCl2) and its mixtures. The first group of samples compares the effects of Ca2+, Mg2+and its combination for an IS of 0.08. The second set of samples was evaluated with Ca2+ and Mg2+solutions at an IS of 0.17. For all the analyses presented, the samples are saturated with oil until reaching Swir with FBI brine (IS = 0.17). The contact angle measurements are executed after the last contact.
Figure 11 presents the spontaneous imbibition curves of the brines with divalent ions at the IS of 0.08.
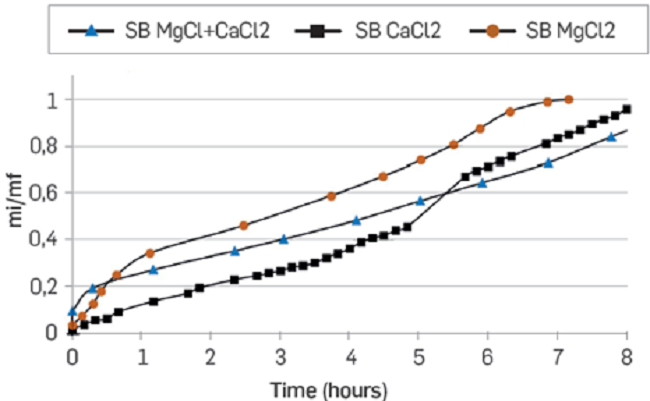
Figure 11
Spontaneous imbibition curves in unconsolidated porous media. Mg2+, Ca2+ and Ca2+ + Mg2+ synthetic brines at IS of 0.08.
MgCl2 brine presents a higher affinity for the rock (Ottawa sand), followed by the CaCl2 brine and the mixture of MgCl2 + CaCl2 at the same IS. As there is no clay in these samples, the result suggests that some components of the oil interact more with magnesium than with Calcium [16], and that fluid-fluid interaction can be strong, generating a multi-ion exchange between the oil, the formation water, and the injection water. It is also possible that the Ottawa sand has some interaction directly with the fluids [22] [23].
On the other hand, Mg2+ and Ca2+ brine were evaluated with an ionic strength of 0.17. Figure 12 shows the spontaneous imbibition curves. In this last case (IS 0.17), the difference between divalent cations is not significant. However, during the first three hours, Mg2+ gains weight faster than Ca2+. This trend changed during the last part of the test. The brines of Mg2+ and Ca2+ imbibes faster at an ionic strength of 0.17 than at 0.08. In both scenarios, the rock shows more preference for Mg2+ than for Ca2+, which is more evident at IS 0.08.
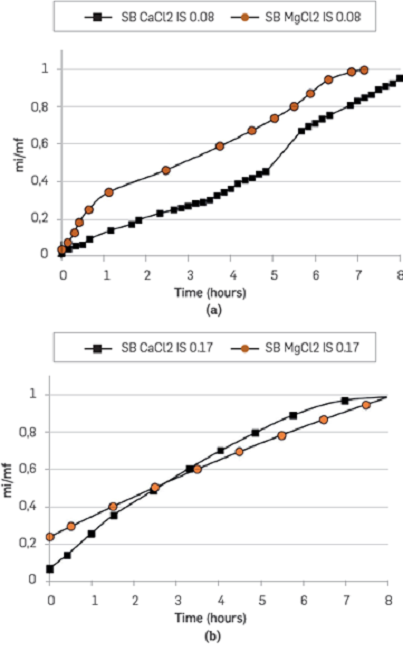
Figure 12
Parallel spontaneous imbibition curves in unconsolidated porous media. Synthetic Mg2+ and Ca2+ brine at an IS of 0.17 and 0.08.
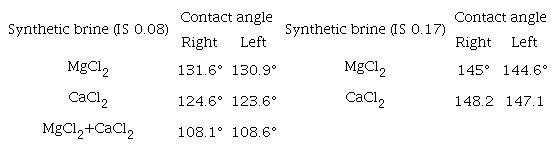
The contact angle measurements in Table 6 corroborate the above mentioned results. The higher contact angle (IS 0.08) corresponds to MgCl2 (131.6°), followed by CaCl2 (124.6°) and MgCl2 + CaCl2 (108.1°). In Figure 12, the imbibition curves for IS 0.17 are quite similar, and the differences in the corresponding contact angles are considered within the experimental error.
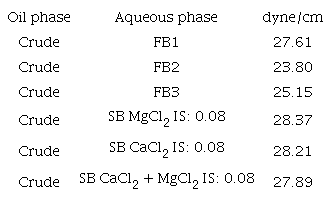
Interfacial tensions: Table7 presents the interfacial tension between the crude oil and every brine considered in this study. The Lowest IFT value in the case of consolidated samples occurred for FB2 (0.08) which indicates a mobility improvement of oil when decreasing ionic strength to 0.08. However, this behavior is not the same as for the tendency of produced oil (secondary case). It is possible that, for the conditions of this study, the mechanisms with more substantial influence are more related to fluid-rock than to fluid-fluid, or that the fluid-fluid mechanisms can not be identified using the interfacial tension.
CONCLUSIONS
-
Displacement tests show the benefit of reducing the ionic strength of water as a tertiary recovery method. A decrease from 0.17 to 0.08 in IS provides an additional 9% oil recovery. A higher reduction, 0.08 to 0.05, does not allow improving the displacement efficiency suggesting that there is an optimal IS, or limited capacity in the reaction of the system, for this recovery process.
-
Given the protocol considered for the tests, it can be seen that, while the initial saturation water is of lower salinity than the injection water or vice versa, the ionic strength contrast between them produces improvements in the oil mobility. The foregoing opens up a range of possibilities for the use of this technology.
-
In Berea rock samples, applying both the spontaneous imbibition curves and the contact angles, FB2 brine (IS 0.08) generated a better displacement efficiency, which could imply that the reduction of the injection water's salinity must be carried to a Limit to obtain the best behavior.
-
In unconsolidated samples, at IS of 0.17, magnesium brine displaced oil better in the early stage, but the final behavior was very similar to that of calcium brine. At IS of 0.08, the magnesium brine was more efficient in displacing the oil. These results highlight the importance of considering every ion independently, and not only the salinity reduction.
-
Given that the crude-oil supported samples did not contain clay, the differences in behavior observed suggest some water-oil interaction as an action mechanism for low salinity water injection
ACKNOWLEDGEMENTS
This work was undertaken as part of the agreement FP44842-338-2017 Doctorado Empresa, ECOPETROL - UNALMED -COLCIENCIAS. The data were kindly provided by Ecopetrol. The resources were provided by the National Fund for Financing Science, Technology and Innovation "Francisco Jose de Caldas".
REFERENCES
[1] Sheng, J. (2014). Critical review of low-salinity water flooding. Journal of Petroleum Science and Engineering, 120, 216-224. doi:https://doi.org/10.1016/j.cetrol.2014.05.026.
[2] Collins, W., Couves, J., Hodges, M., & McBr, E. (2018). Effect of Low Salinity Waterflooding on the Chemistry of the Produced Crude Oil. SPE improved Oil Recovery Conference held in Tulsa, Oklahoma, USA(SPE-190191-MS). doi:https://doi.org/10.2118/190191-MS.
[3] Hugues, D., Larsen, S., & Wright, R. (2010). Review of Low Salinity Water Flooding. Scotland. Senergy. A10DEC015A.
[4] Bartels W.-B., Mahani, H, Berg, S., .Hassanizadeha S.M ¡2019). Literature review of low salinity waterflooding from a length and time scale perspective. Fuel, 236 338-353. doi:https://doi.org/10.1016/j.fuel.2018.09.018.
[5] Rock, A., Hincapié, R. E., Hoffmann, E., & Ganzer, L. (2018, June 8). Tertiary Low Salinity Waterflooding LSWF in Sandstone Reservoirs: Mechanisms, Synergies and Potentials in EOR Applications. Society of Petroleum Engineers. doi:10.2118/190807-MS.
[6] Ligthelm, D. J., Gronsveld, J., Hofman, J., Brussee, N., Marcelis, R, & van der Linde, H. (2009, January 1). Novel Waterflooding Strategy By Manipulation Of Injectior 3rine Composition. Society of Petroleum Engineers. doi:10.2118/U9835-MS.
[7] Vledder, P., Gonzalez, I. E., Carrera Fonseca, J. C, Wells, T., & Ligthelm, D. J. (2010, January 1). Low Salinity Water Flooding: Proof Of Wettability Alteratior On A Field Wide Scale. Society of Petroleum Engineers. doi:10.2118/129564-MS.
[8] Berg, S., Cense, A., Jansen, E., & Bakker, K. (2010). Direct Experimental Evidence of Wettability Modification by Low Salinity. Society of Petrophysicists and Well-Log Analysts, SPWLA-2010-v51n5a3, SPWLA.
[9] Mamonov, A., Kvandal, 0., Strand, S., & Puntervold, T. ¡2019). Adsorption of Polar Organic Components ontc Sandstone Rock Minerals and Its Effect on Wettability and Enhanced Oil Recovery Potential by Smart Water. Energy Fuels, 33(7), 5954-5960. doi:https://doi.org/10.1021/acs.energyfuels.gb00101.
[10] Serrano-Saldaha, E., Dominguez-Ortiz, A., & Pérez-Aguilar, H. (2004). Wettability of solid/brine/n-dodecane systems: experimental study of the effects of ionic strength and surfactant concentration. Colloids and Surfaces A: Physicochem. Eng. Aspects, 343-349. doi:https://doi.org/10.1016/j.colsurfa.2004.04.025.
[11] Allan Katende, F. S. (2019). A Critical review of Low Salinity Water Flooding : Mechanism, Laboratory and Field Application. Journal of Molecular Liquids. Vol. Pages 627-649. doi:https://doi.org/10.1016/j.molliq.2019.01.037.
[12] Hassan N. Al- Saedi, Ralph E. Floria. (2019). Effect of Divalent cations in low salinity water flooding ir sandstone reservoir. Journal of Molecular Liquids. Vol 283. Pages 417-426. doi:https://doi.org/10.1016/j.molliq.2019.03.112.
[13] Bartel W.-B., Mahani H., Berg S., .Hassanizadeh S.M. (2018). Literature review of low salinity waterflooding from a lenght and time scale perspective. FUEL. Vol 236. Pages 338-353. doi:https://doi.org/10.1016/j.fuel.2018.09.018.
[14] Maya, G., Herrera, J., Orrego, J., Rojas, F., Rueda, M., & Manrique, E. (2018). Effect of ionic composition in water: oil interactions in adjusted brine chemistry waterflooding: preliminary results. Revista Fuentes: El Reventón Energético, 73-82. doi:https://doi.org/10.18273/revfue.v16n2-2018005.
[15] Aksulu H., Hâmso D., Strand S., Puntervold T, Austad T. (2012). Evaluation of low Salinity Oil Recovery Effects in Sandstone: Effects of the Temperature and pH Gradient. Energy and Fuels. 26, 6, 3497-3503. doi:https://doi.org/10.1021/ef300162n.
[16] Nasralla, R. A., Alotaibi, M. B., & Nasr-El-Din, H. A. (2011, January 1). Efficiency of Oil Recovery by Low Salinity Water Flooding in Sandstone Reservoirs. Society of Petroleum Engineers. doi:10.2118/144602-MS.
[17] Al-Saedi, H. N., Flori, R. E., Alkhamis, M., & Brady, P. V. (2018, August 16). Coupling Low Salinity Water Flooding and Steam Flooding for Sandstone Reservoirs; Low Salinity-Alternating-Steam Flooding (LSASF). Society of Petroleum Engineers. doi:10.2118/192168-MS.
[18] McGuire, P. L., Chatham, J. R., Paskvan, F. K., Sommer, D. M., & Carini, F. H. (2005, January 1). Low Salinity Oil Recovery: An Exciting New EOR Opportunity for Alaska's North Slope. Society of Petroleum Engineers. doi:10.2118/93903-MS.
[19] Alhuraishawy, A. K., Almansour, A., Bai, B., Wei, M., Imqam, A., & Geng, J. (2018, August 16). Laboratory Screening Tests to Further Characterize Low-Salinity Waterflooding in Low-Permeability Sandstone Reservoir. Society of Petroleum Engineers. doi:10.2118/192159-MS.
[20] RezaeiDoust A., Puntervold T., and Austad Tor. (2011). Chemical Verification of the EOR Mechanism by Using Low Saline/Smart Water in Sandstone. Energy and Fuels. 25, 5, 2151-2162. doi:https://doi.org/10.1021/ef200215y.
[21] Zhang, Y., Xie, X., & Morrow, N. R. (2007, January 1). Waterflood Performance By Injection Of Brine With Different Salinity For Reservoir Cores. Society of Petroleum Engineers. doi:10.2118/109849-MS.
[22] Didier, M., Chaumont, A., Joubert, T., Bondino, I., & Hamon, G. (2015). Contradictory trends for smart water Injection method: role of PH and salinity From sand/oil/brine adhesion maps. SCA2015-005. Canada: International Symposium of the Society of Core.
[23] Vinogradov, J., Jackson, M., & Chamerois, M. (2018). Zeta potential in sandpacks: effect of temperature, electrolyte pH, ionic strength and divalent cations. Colloids and Surfaces. A, Physicochemical and Engineering Aspects, 553, 259-271. doi:https://doi.org/10.1016/j.colsurfa.2018.05.048.
AUTHORS
Author notes
* email: gustavo.maya@ecopetrol.com.co