ABSTRACT
Currently, it is necessary to reduce CO2 emissions into the atmosphere. The oil industry in Colombia can contribute through CO2 injection processes in depleted fields. To achieve this, it is essential to know about the physicochemical interaction of CO2with reservoir fluids. To integrate CO2, water and hydrocarbon phases, advanced models are necessary to capture the phenomenology of thermodynamic equilibrium. The CPA (Cubic-Plus-Association) equation of state adds an associative term to model the interaction of water with the hydrocarbon and CO2 phase.
In this work, the CO2 injection process is thermodynamically modelled in a case study of a depleted reservoir in Colombia. There is a compositional fluid with a gradient of PVT properties in a vertical relief of 10,000 ft, at a depletion condition of 2,000 psi @ 15,374 ft and an oil-water contact (OWC) at 17,000 ft. CO2 injections between 10 and 80 mol% were conducted, and through the CPA equation of state, the swelling conditions of the crude oil, the solubility of CO2 in the formation water, and the pressurization of the system were evaluated. The associative parameters of the equation were taken from literature and estimated through molecular dynamics simulations of water-CO2-Hydrocarbon interaction.
Scheme 4C_1, at CO2 injection conditions greater than 40%, predicts CO2 solubility values greater than 2000 scf/bbl compared to the other literature schemes and experimental data. Scheme 2B_2 presents inconsistencies in saturation pressure calculations at high CO2 injection contents since at 60% it reports a value of 2800 psia and at 80% a value of 2600 psia. This behavior is opposite to that reported in literature. Therefore, association schemes 4C_1 and 2B_2 presented thermodynamic problems for the calculation of properties such solubilities and saturation pressures.
This thermodynamic modelling with an advanced equation of state and use of molecular dynamics simulations enabled us to simulate different CO2 injection scenarios in a compositional fluid. This type of studies is key to conduct successful CO2 injection processes focused on enhanced recovery (EOR) and CO2 storage in the porous medium in a depleted compositional reservoir in Colombia.
KEYWORDS:
CO2 Injection; Depleted Reservoir; Compositional Gradient; Thermodynamic Equilibrium; CPA (Cubic-Plus-Association); Equation of State (EoS)
RESUMEN
En la actualidad es necesario reducir las emisiones de CO2 en la atmósfera. La industria petrolera en Colombia puede contribuir mediante procesos de inyección de CO2 en yacimientos depletados. Para ello, es fundamental tener un conocimiento de las interacciones fisicoquímicas del CO2 con fluidos de yacimiento. Para integrar las 3 fases CO2, agua e hidrocarburo se requieren modelos avanzados que capturen Ta fenomenología del equilibrio termodinâmico. La ecuación de estado CPA (cubic-plus-association), es una ecuación que adiciona de un término asociativo para modelar la interacción del agua con fase hidrocarburo y CO2.
En este trabajo se modela termodinámicamente el proceso de inyección de CO2 en un caso de estudio de un yacimiento depletado colombiano. Se cuenta con un fluido composicional con un gradiente de propiedades PVT en un relieve vertical de 10000 ft a una condición de depletamiento de 2000 psia @ 15374 ft y un contacto agua-petróleo (OWC) a 17000 ft. Se realizaron inyecciones de CO2 entre el 10 y 80% molar, y a través de ecuación de estado CPA, se evaluaron las condiciones de hinchamiento del crudo, solubilidad del CO2 en el agua de formación y presurización del sistema. Los parámetros asociativos de la ecuación fueron tomados de literatura y estimados a través de simulaciones de dinámica molecular de las interacciones agua-CO2-Hidrocarburo, mediante la descripción simplificada de un crudo vivo con contenido de asfaltenos de 1% y metano de 50% mol a 6500 psia y 255 °F.
El esquema 4C_1, en condiciones de inyección de CO2 superiores al 40%, predice valores de solubilidad de CO2 superiores a 2000 scf/ bbl en comparación con los otros esquemas de literatura y los datos experimentales. El esquema 2B_2 presenta inconsistencias en los cálculos de presión de saturación a altos contenidos de inyección de CO2, ya que a 60% reporta un valor de 2800 psia y a 80% un valor de 2600 psia. Este comportamiento es opuesto al reportado en la literatura. Por lo tanto, los esquemas de asociación 4C_1 y 2B_2 presentaron problemas termodinámicos para el cálculo de propiedades como solubilidades y presiones de saturación.
Este modelamiento termodinâmico con ecuación de estado avanzada y uso de simulaciones de dinámica molecular, permitió simular diferentes escenarios de inyección de CO2 en un fluido composicional. El desarrollo de este tipo de estudios es clave para llevar a cabo procesos de inyección de CO2 exitosos enfocados en recobro mejorado (EOR) y almacenamiento de CO2 en el medio poroso en un yacimiento composicional depletado colombiano.
PALABRAS CLAVE:
Inyección de CO2; Yacimiento Depletado; Gradiente Composicional; Equilibrio Termodinâmico; Ecuación de Estado (EoS) CPA (Cubic-Plus-Association)
1. INTRODUCTION
Emissions of carbon dioxide (CO2), one of the main greenhouse gases produced by human activity, have increased in the last century due to the exploitation and use of fossil fuels (IEA, 2008). A possible solution, of great interest to industrial actors, is the processes of CO2 capture, utilization and storage (CCUS) in deep geological formations such as saline aquifers, depleted oil and gas deposits, among others(Chabab et al., 2019Chabab, S., Théveneau, P., Corvisier, J., Coquelet, C Paricaud, P., Houriez, C., & Ahmar, E. El. (2019). Thermodynamic study of the CO2 - H2O - NaCl system: Measurements of CO2 solubility and modeling of phase equilibria using Soreide and Whitson, electrolyte CPA and SIT models. International Journal of Greenhouse Gas Control, 91. 102825. https://doi.org/10.1016/j.ijggc.2019.102825
https://doi.org/10.1016/j.ijggc.2019.102...
). CCUS processes are considered one of the main alternatives to reduce atmospheric CO2 emissions and mitigate climate change, along with improvements in energy efficiency and the promotion of carbon-free energy sources (renewable, nuclear, among others). The International Energy Agency (IEA) estimates that CCUS processes can reduce global CO2 emissions by up to 20% by 2050 (IEA, 2008IEA. (2008). Energy technology perspective. Scenario and strategies to 2050. In Strategies (Issue June). https://iea.blob.core.windows.net/assets/0e190efb-daec-4116-9ff7-ea097f649a77/etp2008.pdf
https://iea.blob.core.windows.net/assets...
).
Although carbon dioxide is typically an odorless, colorless, slightly acidic, and non-flammable gas at standard temperature and pressure, it can transform into a solid, liquid, or supercritical state depending on factors such as pressure and temperature. To maximize the CO2 storage capacity in CCUS projects, it is recommended to inject it in the form of a supercritical fluid (Survey, 1995). At such conditions (above 88°F and al pressure is 1070.3 psia), carbon dioxide most interesting properties are gas-type viscosity and behavior, volume reduction and density increase, allowing a larger volume of CO2 to be stored in the available pore space(Van der Meer et al., 1993Van der Meer, L. G. H. (1993). The conditions limiting CO2 storage in aquifers. Energy Conversion and Management, 34(9-11), 959-966. https://doi.org/10.1016/0196-8904(93)90042-9
https://doi.org/10.1016/0196-8904(93)900...
; Houoway & Survey, 1993Houoway, S., & Survey, B. G. (1993). The potential for aquider disposal of carbon dioxide in the UK. Energy Conversion and Management, 34(9-11), 925-932. https://doi.org/10.1016/0196-8904(93)90038-C
https://doi.org/10.1016/0196-8904(93)900...
). Additionally, the use of supercritical CO2 is preferable to avoid complications with hydrate formation in the injection well, which can occur if CO2 is in a gaseous or liquid state(Baklid et al, 1996Baklid, A., Korbol, R., & Owren, G. (1996, October). Sleipner Vest CO2 disposal, CO2 injection into a shallow underground aquifer. In SPE Annual Technical Conference and Exhibition? (pp. SPE-36600). SPE. https://doi.org/10.2118/36600-MS
https://doi.org/10.2118/36600-MS...
.)
Variations in temperature and pressure exist among sedimentary basins; nevertheless, by considering average surface temperatures, geothermal and hydrostatic gradients, it is established that a minimum subsurface depth of 800 meters is necessary for carbon dioxide (CO2) to attain its supercritical phase (Van der Meer et al., 1993Van der Meer, L. G. H. (1993). The conditions limiting CO2 storage in aquifers. Energy Conversion and Management, 34(9-11), 959-966. https://doi.org/10.1016/0196-8904(93)90042-9
https://doi.org/10.1016/0196-8904(93)900...
; Van Der Meer et al., 1995Van Der Meer, L. G. H., Van der Straaten, R., & Griffioen, J. (1995). Storage of carbon dioxide in aquifers in The Netherlands
. In
Studies in Environmental Science (Vol. 65, pp. 1099-1104). Elsevier. https://doi.org/10.1016/S0166-1116(06)80133-0
https://doi.org/10.1016/S0166-1116(06)80...
). At this depth, 1000 m3 of atmospheric CO2 occupy 3.8 m3, and its density is about 700 g/ cm3. According to Ennis-King and Paterson (Ennis-King & Paterson, 2002Ennis-King, J., & Paterson, L. (2002, October). Engineering aspects of geological sequestration of carbon dioxide. In SPE Asia Pacific Oil and Gas Conference and Exhibition (pp. SPE-77809). SPE. https://doi.org/10.2523/77809-MS
https://doi.org/10.2523/77809-MS...
), the density of supercritical CO2 is approximately 30-40% less than a formation water under the same conditions. The lighter CO2 will rise upwards through the formation water by buoyancy and will accumulate at the highest possible point in the reservoir beneath the seal(Van der Meer et al., 1993Van der Meer, L. G. H. (1993). The conditions limiting CO2 storage in aquifers. Energy Conversion and Management, 34(9-11), 959-966. https://doi.org/10.1016/0196-8904(93)90042-9
https://doi.org/10.1016/0196-8904(93)900...
; Ennis-King & Paterson, 2002Ennis-King, J., & Paterson, L. (2002, October). Engineering aspects of geological sequestration of carbon dioxide. In SPE Asia Pacific Oil and Gas Conference and Exhibition (pp. SPE-77809). SPE. https://doi.org/10.2523/77809-MS
https://doi.org/10.2523/77809-MS...
).
Understanding the CO2 solubility phenomenon is essential to increase the efficiency of CCUS processes such as CO2 injection in enhanced recovery (EOR). The mechanism of interest occurs due to dissolution in the reservoir fluids, which depends on the phases present in thermodynamic equilibrium(Chen et al., 2022Chen, Z., Zhou, Y., & Li, H. (2022). A Review of Phase Behavior Mechanisms of CO2 EOR and Storage in Subsurface Formations. Industrial and Engineering Chemistry Research, 61(29), 10298-10318. https://doi.org/10.1021/acs.iecr.2c00204
https://doi.org/10.1021/acs.iecr.2c00204...
). Understanding and modeling the phase behavior of water-crude-CO2 systems in a wide range of temperatures, pressures, and composition, will lead to the correct design and optimization of injection processes (Sun et al., 2021Sun, X., Wang, Z., Li, H., He, H., & Sun, B. (2021). A simple model for the prediction of mutual solubility in CO2-brine system at geological conditions. Desalination, 504, 114972. https://doi.org/10.1016/j.desal.2021.114972
https://doi.org/10.1016/j.desal.2021.114...
). Considering that experimental measurements of this type of recovery are time-consuming and expensive(Li et al., 2001Li, J., Topphoff, M., Fischer, K., & Gmehling, J. (2001). Prediction of gas solubilities in aqueous electrolyte systems using the predictive Soave- Redlich- Kwong model. Industrial & engineering chemistry research, 40(16), 3703-3710. https://doi.org/10.1021/ie0100535
https://doi.org/10.1021/ie0100535...
), predictive thermodynamic models become an adequate and efficient alternative to predict the relevant phase equilibria in these processes and to overcome the limitations of experimental methods.
Equations of state (EoS) allow modeling the thermodynamic equilibrium of fluids in the reservoir during CO2 injection and storage. However, it is challenging for conventional EoS to accurately model the thermodynamic behavior of CO2-containing mixtures. (Chen et al., 2022Chen, Z., Zhou, Y., & Li, H. (2022). A Review of Phase Behavior Mechanisms of CO2 EOR and Storage in Subsurface Formations. Industrial and Engineering Chemistry Research, 61(29), 10298-10318. https://doi.org/10.1021/acs.iecr.2c00204
https://doi.org/10.1021/acs.iecr.2c00204...
). For example, the SRK EoS fails to accurately correlate the minimum water concentration in the CO2-rich vapor phase for the binary CO2 + water mixture, even when using a significant binary interaction parameter. The estimation of CO2 solubility in the aqueous phase is commonly performed using Henry's law, which may not provide accurate results for a liquid phase that is rich in CO2 and in equilibrium with water. This phenomenon is caused by the presence of a substantial quadrupole moment in CO2. This quadrupole moment represents the concentration of charges at four different points within the CO2 molecule, leading to directional interactions. Therefore, depending on the surrounding molecules, CO2 may function as a Lewis acid (electron acceptor) or base (electron donor)(Danten et al., 2005Danten, Y., Tassaing, T., & Besnard, M. (2005). Ab initio nvestigation of vibrational spectra of water-(CO2) n complexes (n= 1, 2). The Journal of Physical Chemistry A, 109(14), 3250-3256. https://doi.org/10.1021/jp0503819
https://doi.org/10.1021/jp0503819...
). The thermodynamic properties and phase behavior of a CO2 molecule can be notably affected by its quadrupole moment, especially at low temperatures. For example, the quadrupole moment of CO2 is believed to account for the observed low temperature azeotrope in the vapor-liquid equilibrium (VLE) between CO2 and ethane mixtures. Furthermore, in conjunction with size asymmetry, it is also responsible for the occurrence of liquid-liquid equilibrium (LLE) between CO2 and heavy hydrocarbons(Bjørner, 2016Bjørner, M. G., & Kontogeorgis, G. M. (2016). Modeling derivative properties and binary mixtures with CO2 using the CPA and the quadrupolar CPA equations of state. Fluid Phase Equilibria, 408, 151-169. https://doi.org/10.1016/j.fluid.2015.08.011.
https://doi.org/10.1016/j.fluid.2015.08....
).
The use of EoS, based on the study of molecular interactions and associative properties of the components, such as SAFT (Statistical Associating Fluid Theory) and CPA (Cubic-Plus-Association), improves the accuraacy of the results compared to the modified conventional EoS used until the moment(Jindrová et al., 2016Jindrova, T., Mikyška, J., & Firoozabadi, A. (2016). Phase behavior modeling of bitumen and light normal alkanes and CO2 by PR-EOS and CPA-EOS. Energy & Fuels, 30(1), 515-525. https://doi.org/10.1021/acs.energyfuels.5b02322
https://doi.org/10.1021/acs.energyfuels....
; Nasrabadi et al., 2016Nasrabadi, H., Moortgat, J., & Firoozabadi, A. (2016). New three-phase multicomponent compositional model for asphaltene precipitation during CO2 injection using CPA-EOS. Energy & Fuels, 30(4), 3306-3319. https://doi.org/10.1021/acs.energyfuels.5b02944
https://doi.org/10.1021/acs.energyfuels....
; Sanchez-Vicente et al., 2018Sanchez-Vicente, Y., Tay, W. J., Al Ghafri, S. Z., & Trusler, J. M. (2018). Thermodynamics of carbon dioxide-hydrocarbon systems. Applied Energy, 220, 629-642. https://doi.org/10.1016/j.apenergy.2018.03.136
https://doi.org/10.1016/j.apenergy.2018....
). Considering the relevance of modeling thermophysical properties for hydrocarbon and CO2 mixtures in the design and optimization of injection processes in depleted reservoirs, Sánchez-Vicente, et al. (Sanchez-Vicente et al., 2018) conducted a study of the CO2 and n-heptane system. In this research, the densities of the saturated phase, the compressed fluids, and bubble and dew points are measured. The results compare the predictive capacity of two thermodynamic models: The Peng-Robinson predictive equation, and a version of the Statistical Association Fluid Theory (SAFT), known as SAFT-y Mie. The two models use the group contribution method to estimate the interaction parameters, and are applied to complex multicomponent systems. Both approaches are reliable as for phase behavior, but neither model satisfactorily predicts density (Al Ghafri & Trusler, 2019Al Ghafri, S. Z., & Trusler, J. P. M. (2019). Phase equilibria of (Methylbenzene + Carbon dioxide + Methane) at elevated pressure: Experiment and modelling. Journal of Supercritical Fluids, 145. 1-9. https://doi.org/10.1016/j.supflu.2018.11.012
https://doi.org/10.1016/j.supflu.2018.11...
; Dufal et al., 2014Dufal, S., Papaioannou, V., Sadeqzadeh, M., Pogiatzis, T., Chremos, A., Adjiman, C. S.....& Galindo, A. (2014). Prediction of thermodynamic properties and phase behavior of fluids and mixtures with the SAFT-H Mie group-contribution equation of state. Journal of Chemical & Engineering Data, 59(10), 3272-3288. https://doi.org/10.1021/je500248h
https://doi.org/10.1021/je500248h...
; Papaioannou et al., 2016Papaioannou, V. , Calado, F., Lafitte, T., Dufal, S. , Sadeqzadeh, M. , Jackson, G..... & Galindo, A. (2016). Application of the SAFT-H Mie group contribution equation of state to fluids of relevance to the oil and gas industry. Fluid Phase Equilibria, 416, 104-119. https://doi.org/10.1016/j.fluid.2015.12.041
https://doi.org/10.1016/j.fluid.2015.12....
). Negahban, et al.(Negahban et al., 2020Negahban, S., Kazemi, M., Kalantari, M., Dindoruk, B., & Elshahawi, H. (2020). "Digital Fluid Physics": Prediction of phase equilibria for several mixtures of CO2 with petroleum fluid systems. Journal of Petroleum Science and Engineering, 187, 106752. https://doi.org/10.1016/j.petrol.2019.106752
https://doi.org/10.1016/j.petrol.2019.10...
) perform molecular dynamics simulations with the use of SAFT-y and coarse-grained, a model developed by Herdes, et al.(Herdes et al., 2015Herdes, C., Totton, T. S., & Müller, E. A. (2015). Coarse grained force field for the molecular simulation of natural gases and condensates. Fluid Phase Equilibria, 406, 91100. https://doi.org/10.1016/j.fluid.2015.07.014
https://doi.org/10.1016/j.fluid.2015.07....
) in 2015, to determine the phase behavior of a binary, ternary, and multicomponent CO2/hydrocarbon system. These systems include CO2/n-hexadecane, CO2/n-butane/n-decane, and CO2/synthetic oil. The SAFT-y model turns out to be a good candidate to simulate the phase behavior of light oils, but it can be improved for more complex systems. Molecular simulation can provide quantitative calculations of the phase behavior of petroleum mixtures when data are limited or unavailable, thereby reducing the cost and time required to fit equations of state for compositional reservoir simulators. This modeling type has succeeded in numerous industrial applications to predict phase behavior for a wide spectrum of scenarios such as vapor-liquid (VL), liquid-liquid (LL) and vapor-liquid-liquid (VLL)(Avendaño et al., 2011Avendaño, C., Lafitte, T., Galindo, A., Adjiman, C. S., Jackson, G., & Müller, E. A. (2011). SAFT-H force field for the simulation of molecular fluids. 1. A single-site coarse grained model of carbon dioxide. Journal of Physical Chemistry B, 115(38), 11154-11169. https://doi.org/10.1021/jp204908d
https://doi.org/10.1021/jp204908d...
; Mejía et al., 2014).
In turn, using the EoS CPA, Oliveira, et al. (Oliveira et al., 2011Oliveira, M. B., Queimada, A. J., Kontogeorgis, G. M., & Coutinho, J. A. P. (2011). Evaluation of the CO2 behavior in binary mixtures with alkanes, alcohols, acids and esters using the Cubic-Plus-Association Equation of State. Journal of Supercritical Fluids, 55(3), 876-892. https://doi.org/10.1016/j.supflu.2010.09.036
https://doi.org/10.1016/j.supflu.2010.09...
) investigate the phase equilibrium of binary CO2 systems with n-alkanes, n-alcohols, esters, and n-acids over a wide range of temperatures and pressures. The compounds used represent self-associative, non-associative, and cross-associative components, to describe in detail the possible interactions of CO2. The authors determine the importance of the self-associative and cross terms for CO2 with n-alkanes, to adequately describe the LV Equilibrium of the system. In 2015, Tsivintzelis et al.(Tsivintzelis et al., 2015Tsivintzelis, I., & Kontogeorgis, G. M. (2015). Modelling phase equilibria for acid gas mixtures using the CPA equation of state. Part V: Multicomponent mixtures containing CO2 and alcohols. The Journal of Supercritical Fluids, 104, 29-39. https://doi.org/10.1016/j.supflu.2015.05.015
https://doi.org/10.1016/j.supflu.2015.05...
a) evaluated different associative configurations of CO2 in mixtures with alkanes (n-C36) to determine their performance when modeling phase equilibrium. CO2 is treated as a non-associative, self-associative fluid with schemes 2B, 3B, and 4C. CPA parameters for alkanes to date only reached n-C20; new parameters are estimated for heavier alkanes based on a correlation developed according to the Design Institute for Physical Properties database (DIPPR). The results are compared with experimental literature data for three different heavy alkanes obtaining an accurate approximation. Similar works are conducted to evaluate the associative terms of CO2 with different compounds (Tsivintzelis et al., 2011a; Tsivintzelis & Kontogeorgis, 2015Tsivintzelis, I., & Kontogeorgis, G. M. (2015). Modelling phase equilibria for acid gas mixtures using the CPA equation of state. Part V: Multicomponent mixtures containing CO2 and alcohols. The Journal of Supercritical Fluids, 104, 29-39. https://doi.org/10.1016/j.supflu.2015.05.015
https://doi.org/10.1016/j.supflu.2015.05...
). Jidrova et al.(Jindrová et al., 2016Jindrova, T., Mikyška, J., & Firoozabadi, A. (2016). Phase behavior modeling of bitumen and light normal alkanes and CO2 by PR-EOS and CPA-EOS. Energy & Fuels, 30(1), 515-525. https://doi.org/10.1021/acs.energyfuels.5b02322
https://doi.org/10.1021/acs.energyfuels....
), and compare the performance of Peng-Robinson and CPA EoS to model the phase behavior of CO2 mixtures with bitumen and light alkanes. The results show that Peng-Robinson describes the mixtures adequately when there is no presence of a second liquid phase, or the content of asphaltene in the second phase rich in CO2 is low. The CPA model accurately describes the phase behavior in systems with two liquid phases, even when the asphaltene content is high in the second. Due to the presence of asphaltenes, the self-associative and cross terms are relevant for describing the LV Equilibrium, which gives an advantage to the CPA model over Peng-Robinson in this type of mixtures.
Nasrabadi et al.(Nasrabadi et al., 2016Nasrabadi, H., Moortgat, J., & Firoozabadi, A. (2016). New three-phase multicomponent compositional model for asphaltene precipitation during CO2 injection using CPA-EOS. Energy & Fuels, 30(4), 3306-3319. https://doi.org/10.1021/acs.energyfuels.5b02944
https://doi.org/10.1021/acs.energyfuels....
), also study the presence and precipitation of asphaltenes during CO2 injection processes through the EoS CPA. The authors highlight the poor capacity of conventional EoS to model the equilibrium in hydrocarbon phases with high asphaltene content. The use of CPA provides accurate results for 2D and 3D simulations of CO2 injection into Weyburn oil, for multiphase flows with high asphaltene content. Other authors have modified the EoS CPA to model phase equilibrium with CO2. Bjørner and Kontogeorgis(Bjørner & Kontogeorgis, 2016Bjørner, M. G., & Kontogeorgis, G. M. (2016). Modeling derivative properties and binary mixtures with CO2 using the CPA and the quadrupolar CPA equations of state. Fluid Phase Equilibria, 408, 151-169. https://doi.org/10.1016/j.fluid.2015.08.011.
https://doi.org/10.1016/j.fluid.2015.08....
) include quadrupole interactions in the CPA, based on the work of Larsen et al.(Larsen et al., 1977Larsen, B., Rasaiah, J. C., & Stell, G. (1977). Thermodynamic perturbation theory for multipolar and onic liquids. Molecular Physics, 33(4), 987-1027. https://doi.org/10.1080/00268977700100901
https://doi.org/10.1080/0026897770010090...
). The new model evaluates the predictive capacity for binary vapor-liquid and liquid-liquid systems with high CO2 content in mixtures with hydrocarbons, water, alcohol, and quadrupole components. The inclusion of the new term becomes relevant in mixtures of CO2 with hydrocarbons, where it correctly predicts the binary behavior of the phases. To study the solubility of CO2 in formation water, Bian et al.(Bian et al., 2019Bian, X. Q., Xiong, W., Kasthuriarachchi, D. T. K., & Liu, Y. B. (2019). Phase equilibrium modeling for carbon dioxide solubility in aqueous sodium chloride solutions using an association equation of state. Industrial and Engineering Chemistry Research, 58(24). 10570-10578. https://doi.org/10.1021/acs.iecr.9b01736
https://doi.org/10.1021/acs.iecr.9b01736...
) present a thermodynamic model based on the CPA equation of state combined with the Wong-Sandler mixing rule (CPA-WS) and evaluate its performance in reproducing the solubility of CO2 in water and aqueous NaCl solutions. The model confirms that the inert association scheme is more suitable for CO2 than the 3B association scheme, in the CO2-H2O system. Meanwhile, the CO2-H2O-NaCl system can be predicted by using two adjustable parameters of H2O-NaCl and CO2-NaCl systems. The mean deviations of the predicted solubility of CO2 in water and aqueous NaCl solutions from the CPA-WS model are 5.31 and 3.56%, respectively.
It can be noticed that the work performed for multiphase systems with CO2-water-hydrocarbon at the same time is scarce, so the study of thermodynamic equilibrium is relevant to optimize the design of CO2 injection processes in reservoirs depleted of hydrocarbons. Equations of State such as CPA offer different advantages over conventional EoS, as they can adequately describe the associative interaction with different compounds, mainly asphaltenes present in liquid phases. Additionally, the presence of water in these systems incorporates important electrostatic interaction with CO2 and other hydrocarbon compounds that reduce their solubility in the mixture, which can be represented by the associative interactions of the EoS CPA.
Therefore, in this work, it was decided to use the EoS CPA to study the thermodynamic behavior of systems CO2, water, and hydrocarbon in a CO2 injection process (10 - 80 mole%) and water contents (25 and 50 mole%) for a case study of a depleted reservoir in Colombia. The evaluation of this behavior was prformed considering variables such as the swelling of the crude oil, the solubility of CO2 in water, and the pressurization of the system. The associative parameters for the different systems were taken from the literature and, additionally, molecular dynamics (MD) simulations were conducted, focused on CO2-hydrocarbon-water systems, to obtain the necessary association parameters for CPA.
This research introduces a broad framework for using the CPA to model the CO2 injection process in Colombian oil reservoirs. The framework accounts for the unique characteristics of CO2, including its quadrupole interaction, and the cross association between H2O and CO2 molecules, added to the association between H2O molecules.
2. THEORETICAL FRAMEWORK
CPA EQUATION OF STATE.
All thermodynamic functions of a fluid can be derived from an equation of state. The equation of state for phase "p" can be written as follows:

All the complexities of non-ideal behavior are captured in the compressibility factor Za. In particular, the general form of a cubic equation of state is:
The non-ideal behavior comes from the temperature-dependent physical (van der Waals) interaction between the molecules (represented byAα) and the temperature-independent finite volume occupied by the molecules. However, there is a very important effect whose description, so far, cannot be described using traditional cubic equations. This effect is an explicit explanation of hydrogen bonds or, in general, Lewis acid-Lewis base interactions, species that can receive and donate electrons, respectively. This phenomenon, of which hydrogen bonding is a good example, is characterized by strong short-range attractive interactions, and it is closely related to the polarity of fluid molecules.
The CPA model combines the Peng-Robinson (PR) or Soave-Reidlich-Kwong (SRK) equations of state, which consider the physical interactions between molecules, with the Wertheim association theory. An associative term is added that represents the interactions, hydrogen bond type, self, or cross between the active sites of the different types of molecules present in the fluid of interest. Equation 3 represents the CPA model:

where Zα phys is the contribution to the compressibility factor of the cubic equation of state, and Zα assoc is the contribution to the compressibility factor of the association theory. The associative term is given by:

where X Ai is the fraction of unbound sites of the A sites in compound i, Δ AiBj is the strength of association between the association sites of compounds i and j. This strength is dependent on the terms β Ai Bi and ε Ai Bi , which correspond to the association volumes and energies between the possible association sites A and B, respectively.
Based on the foregoing, to model a system using the EoS CPA, a total of 3 parameters are required for the non-associative components (Zα phys): Critical Temperature (Tc), Critical Pressure (Pc), and Acentric Factor (w), and, 5 for the associative components(Zα phys,Zα assoc): Tc, Pc, ω,ß AiBj and ε AiBj .
The dependence of the association term on the association scheme, specifically the number and type of association sites, is evident from equation 5. The simplified notation proposed by Huang and Radosz is used in this study (Huang & Radosz, 1990Huang, S. H., & Radosz, M. (1990). Equation of state for small, large, polydisperse, and associating molecules. Industrial & Engineering Chemistry Research, 29(11), 2284-2294. https://doi.org/10.1021/ie00107a014
https://doi.org/10.1021/ie00107a014...
). In this case, the number of the association scheme represents the total number of association sites of the molecule, and the letter represents the type of association (corresponding count of electron donor and acceptor sites). For example, the association scheme 2B represents a molecule with two association sites, one electron donor (1ed) and electron acceptor (1ea). The association scheme 3B represents a molecule with three association sites, 1ed and 2ea or 2ed and 1ea. Finally, the association scheme 4C represents a molecule with four association sites, 2ed and 2ea.
In Figure 1, the process is exemplified in the form of an algorithm that must be followed to solve the CPA equation of state and to obtain the fractions of the phases of each component, as well as their properties at the pressure and temperature conditions evaluated. The objective is to find the state that minimizes the global Gibbs free energy of the system and ensures the stability of the phases. To such end, the general equation that combines the difference in fugacity and the mass balance for all components is minimized. First, the EoS parameters must be calculated through the initial information given and the fugacity obtained. Then, it is necessary to calculate the matrix of associative terms between the different sites of the molecules to obtain the value of the associative part in the CPA model. Thus, the fractions of phases are iterated until the fugacity coefficients are determined and meet the established margin of error. This process obtains the mole fractions of all the components in the liquid or gas phase, from which it is possible to determine their properties and solubility in the total composition of the fluid.
3. METHODOLOGY
This study focuses on understanding the interactions that occur within depleted reservoirs in CO2 injection processes in CCUS projects using the EoS CPA. Included below are some basic concepts, considerations, and simplifications to study the thermodynamic behavior of CO2, water, and hydrocarbon systems.
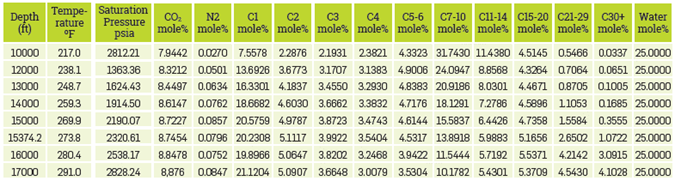
Case Study. Table 1 shows a summary of the main properties of the reservoir fluid used in this study. This fluid has composition, conventional PVT experimental tests, CO2 injection tests, minimum miscibility pressures, and asphaltene content. All this experimental information enabled us to build a robust, complete, and thermodynamically consistent fluid model for this fluid system. All simulations in this study were carried out using the EoS Peng-Robinson(Peng & Robinson, 1976Peng, D.-Y., & Robinson, D. B. (1976). A new two-constant equation of state. Industrial & Engineering Chemistry Fundamentals, 15(1), 59-64. https://doi.org/10.1021/i160057a011
https://doi.org/10.1021/i160057a011...
) with Peneloux volume correction(Péneloux et al., 1982Péneloux, A., Rauzy, E., & Fréze, R. (1982). A consistent correction for Redlich-Kwong-Soave volumes. Fluid Phase Equilibria, 8(1), 7-23. https://doi.org/10.1016/0378-3812(82)80002-2
https://doi.org/10.1016/0378-3812(82)800...
), independent of the temperature for modeling the physical part of the system. The EoS parameters were derived from the experimental information available. A fluid quality control (QC) included an initial simulation of Saturation Pressures, GOR and dead oil density. Small regressions were conducted on the BIC's (Binary Interaction Coefficients) between the hydrocarbons to adjust the PVT gradient properties in vertical relief (Martinsen et al., 2010Martinsen, S. 0., Castiblanco, L., Osorio, R., & Whitson, C. H. (2010, September). Advanced Fluid Characterization of Pauto Complex, Colombia. In SPE Annual Technical Conference and Exhibition? (pp. SPE-135085). SPE. https://doi.org/10.2118/135085-MS
https://doi.org/10.2118/135085-MS...
), and between CO2 and the pseudo components to adjust the gas injection tests.
Studied Systems. The compositional fluid studied has a gradient of PVT properties in a vertical relief of 10,000 ft at a depletion condition of 2,000 psi @ 15,374 ft and an oil-water contact (OWC) at 17,000 ft. Considering the above and, injecting CO2 at 10, 20, 40, 60 and 80 mole% with different amounts of water in the reservoir (25 and 50 mole%), in total, 72 fluid systems with compositions and different temperatures. In Table 2, a fluid systems example can be observed at depletion conditions, with an injection of 10 mole% CO2 and 25 mole% water throughout the vertical relief.
The BIC's between water and hydrocarbons were maintained at 0, while the Binary Interaction Coefficients between water and CO2 were taken from literature.(Tsivintzelis et al., 2011Tsivintzelis, I., Kontogeorgis, G. M., Michelsen, M. L., & Stenby, E. H. (2011). Modeling phase equilibria for acid gas mixtures using the CPA equation of state. Part II: Binary mixtures with CO2. Fluid Phase Equilibria, 306(1), 38-56. https://doi.org/10.1016/j.fluid.2011.02.006
https://doi.org/10.1016/j.fluid.2011.02....
b)
ASSOCIATIVE PARAMETERS OF LITERATURE.
In this work, the associative components of the system are CO2 and water. It is woth noting that although hydrocarbons are not considered associative components, they are part of the system and have a specific composition, as can be seen in Table 2. As mentioned above, 5 parameters are required for water and CO2, as they are associative components. The critical properties and the acentric factor are already well defined, unique, and can be found in literature. (Tsivintzelis et al., 2015Tsivintzelis, I., & Kontogeorgis, G. M. (2015). Modelling phase equilibria for acid gas mixtures using the CPA equation of state. Part V: Multicomponent mixtures containing CO2 and alcohols. The Journal of Supercritical Fluids, 104, 29-39. https://doi.org/10.1016/j.supflu.2015.05.015
https://doi.org/10.1016/j.supflu.2015.05...
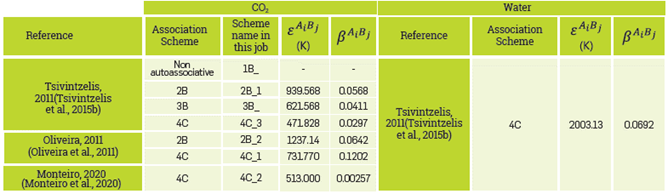
b) However, the parameters and associative configurations may vary depending on the author, especially those related to CO2. Table 3 shows the different association schemes used for CO2 and water. Considering the 72 previously mentioned systems and the 7 schemes worked for CO2, in total, there are 504 fluid systems with different physicochemical and thermodynamic properties.
ASSOCIATIVE PARAMETERS MOLECULAR DYNAMICS (MD).
In this study, an MD model was proposed to understand the nterfacial behavior of the interaction of CO2 with the hydrocarbon and the aqueous phase. To achieve this, some simplifications were made. First, the crude oil matrix was represented by a mixture of n-heptane and toluene, widely used in the literature, known as heptol,(Moncayo-Riascos et al., 2022Moncayo-Riascos, I., Rojas-Ruiz, F. A., Orrego-Ruiz, J. A., Cundar, C., Torres, R. G., & Cañas-Marín, W. (2022). Reconstruction of a synthetic crude oil using petroleomics and molecular dynamics simulations: A multistructural approach to understanding asphaltene aggregation behavior. Energy & Fuels, 36(2), 837-850. https://doi.org/10.1021/acs.energyfuels.1c03497
https://doi.org/10.1021/acs.energyfuels....
; Ramírez et al., 2021Ramírez, L., Moncayo-Riascos, I., Cortés, F. B., Franco, C. A., & Ribadeneira, R. (2021). Molecular dynamics study of the aggregation behavior of polycyclic aromatic hydrocarbon molecules in n-heptane-toluene mixtures: Assessing the heteroatom content effect. Energy and Fuels, 35(4), 3119-3129. https://doi.org/10.1021/acs.energyfuels.0c04153
https://doi.org/10.1021/acs.energyfuels....
; Yuan Yang, (Yang et al., 2018Yang, Y., Chaisoontornyotin, W., & Hoepfner, M. P. (2018). Structure of asphaltenes during precipitation investigated by ultra-small-angle x-ray scattering. Langmuir, 34(35), 10371-10380. https://doi.org/10.1021/acs.langmuir.8b01873
https://doi.org/10.1021/acs.langmuir.8b0...
) using a 70:30 ratio (Figure 2-a). To describe the asphaltene fraction, a molecular structure proposed in a previous work for Colombian crude oil was used (Figure 2-b), (Moncayo-Riascos et al., 2022Moncayo-Riascos, I., Rojas-Ruiz, F. A., Orrego-Ruiz, J. A., Cundar, C., Torres, R. G., & Cañas-Marín, W. (2022). Reconstruction of a synthetic crude oil using petroleomics and molecular dynamics simulations: A multistructural approach to understanding asphaltene aggregation behavior. Energy & Fuels, 36(2), 837-850. https://doi.org/10.1021/acs.energyfuels.1c03497
https://doi.org/10.1021/acs.energyfuels....
), which was the most aggressive in terms of aggregation, with a concentration of 1% by weight. The molecular structure was proposed from petroleomics, which allows studying the "genetics of crude oil", obtaining molecular descriptors that allow us to propose reliable molecular structures that capture the structural and compositional particularities of the different fractions of crude oil (Moncayo-Riascos et al., 2022Moncayo-Riascos, I., Rojas-Ruiz, F. A., Orrego-Ruiz, J. A., Cundar, C., Torres, R. G., & Cañas-Marín, W. (2022). Reconstruction of a synthetic crude oil using petroleomics and molecular dynamics simulations: A multistructural approach to understanding asphaltene aggregation behavior. Energy & Fuels, 36(2), 837-850. https://doi.org/10.1021/acs.energyfuels.1c03497
https://doi.org/10.1021/acs.energyfuels....
).
a) Number of molecules and mole composition of the system evaluated in DM and (b) initial configuration. Carbon atoms are shown in gray, oxygen in red, heptol in yellow (transparent), and water in blue (transparent).
The gas content was represented using only methane at a molar concentration of 50%, to have a computational representation of a live crude oil. The CO2 content was 40 mole% with respect to live crude oil (asphaltenes, heptol, and methane). Although we have a simplified system in this study, it is worth noting that the system has a considerable computational cost since there is a considerable number of molecules of each species evaluated (Figure 2-a), so the simulations were carried out using high-performance computing machines from AWS (Amazon Web Services).
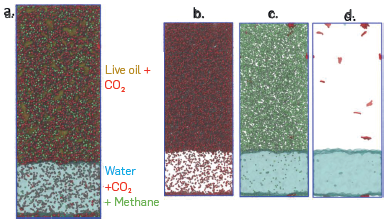
Figure 2-c shows the initial configuration of the system evaluated in DM, initially with three phases (live crude oil, CO2, and water). In a first approach, a simulation was conducted in which the boundary in the z-direction, that is, in the direction perpendicular to the interface, was considered reflective. This indicates that molecules that exceed the limits in z are reflected within the simulation box with the same speed but in the opposite direction. This was done to validate what the distribution of CO2 is like between an aqueous phase and a model solution of a live crude oil. The results indicated that CO2 tends to occupy the entire volume occupied by the model solution of live crude oil. Therefore, after this validation, simulations were conducted with periodic conditions in all directions, representing a water-living crude oil interface, that is, without considering reflective boundaries in the z-direction. Simulations were carried out at a pressure of 6500 psi and 255°F.
All molecular dynamics simulations were performed using the free LAMMPS software (Plimpton, 1995Plimpton, S. (1995). Fast Parallel Algorithms for Short - Range Molecular Dynamics. Journal of Computational Physics, 117, 1-19. https://doi.org/10.1006/jcph.1995.1039
https://doi.org/10.1006/jcph.1995.1039...
). VMD visualization software(William et al., 1996William, H. (1996). VMD-visual molecular dynamics. Journal of molecular graphics, 14, 33-38. https://doi.org/10.1016/0263-7855(96)00018-5
https://doi.org/10.1016/0263-7855(96)000...
) was used to obtain images and radial distribution functions. Temperature and pressure were controlled by the Nosé-Hoover thermostat and the barostat, respectively. The interaction parameters between atoms of different natures were defined by the geometric average mixing rules. Long-range electrostatic interactions were calculated using the particle-particle-particle-mesh method(Hockney & Eastwood, 1988Hockney, R. W. 0, & Eastwood, J. W. (1988). Computer Simulation Using Particles (A. Hilger, Ed.). https://doi.org/10.1201/9780367806934
https://doi.org/10.1201/9780367806934...
). The cutoff radius was established at 14 A for van der Waals and electrostatic interactions, in accordance with that reported in the literature (Moncayo-Riascos et al., 2022Moncayo-Riascos, I., Rojas-Ruiz, F. A., Orrego-Ruiz, J. A., Cundar, C., Torres, R. G., & Cañas-Marín, W. (2022). Reconstruction of a synthetic crude oil using petroleomics and molecular dynamics simulations: A multistructural approach to understanding asphaltene aggregation behavior. Energy & Fuels, 36(2), 837-850. https://doi.org/10.1021/acs.energyfuels.1c03497
https://doi.org/10.1021/acs.energyfuels....
; van Rooijen et al., 2023Van Rooijen, W. A., Habibi, P., Xu, K., Dey, P., Vlugt, T. J. H., Hajibeygi, H., & Moultos, O. A. (2023). Interfacial tensions, solubilities, and transport properties of the H2/ H2O/NaCl system: A molecular simulation study. Journal of Chemical & Engineering Data, 69(2), 307-319. https://doi.org/10.1021/acs.jced.2c00707
https://doi.org/10.1021/acs.jced.2c00707...
).
4 RESULTS
ASSOCIATIVE PARAMETERS OF LITERATURE.
As mentioned in the introduction, the evaluation of thermodynamic behavior using CPA is performed considering variables such as Gas - Oil Ratio (GOR - scf/bbl), density of crude oil and water for swelling processes, Gas - Water Ratio (GWR - scf/bbl) of CO2 and C1 to quantify solubilities, and saturation pressures to estimate the pressurization of the various systems.
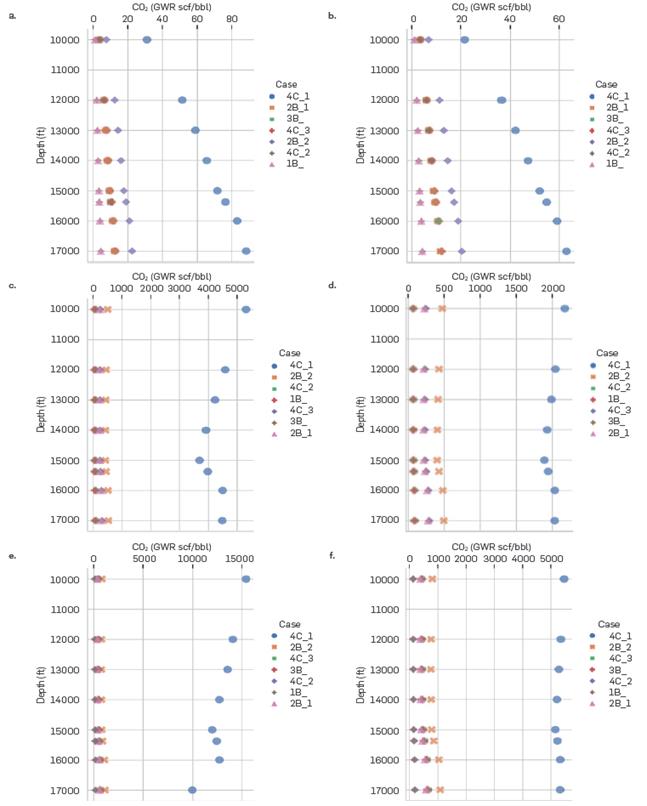
In Figure 3, the amount of CO2 that is solubilized in the aqueous phase can be observed for different depths at three different injection contents (0, 40 and 80 mole%) and two amounts of water (25 and 50 mole%). As expected, the CO2 content present in the aqueous phase increases with greater quantities of injected gas, and all association schemes can represent this behavior (Figure 3-a,c,e). However, scheme 4C_1, at injection conditions higher than 40%, predicts solubility values that are too high (greater than 2000 scf/ bbl) compared to the other schemes and experimental data (Valtz et al., 2004Valtz, A., Chapoy, A., Coquelet, C ., Paricaud, P. , & Richon, D. (2004). Vapour-liquid equilibria in the carbon dioxide-water system, measurement and modelling from 278.2 to 318.2 K. Fluid phase equilibria, 226, 333-344. https://doi.org/10.1016/j.fluid.2004.10.013
https://doi.org/10.1016/j.fluid.2004.10....
). Additionally, this scheme is the only one that presents large variations in solubility with different water contents. At 40% CO2 injection, it is observed that scheme 4C_1 predicts a value of 4500 scf/bbl at 14000 ft for 25% water (Figure 3-c), while for 50% a value of 2000 scf/bbl (Figure 3-d) is obtained. Comparing these results with the other association schemes that present minimal variations (1-8 scf/bbl) between different water contents at different depths, allows us to show that the 4C_1 scheme is not the most appropriate to work with these water-CO2-hydrocarbons systems. Based on the above, scheme 4C_1 is not considered for subsequent analyses.
Studying the behavior of other components present in high proportions in reservoir fluids such as those studied in this work (fluids close to the critical point) is essential to understand, at a thermodynamic level, all the events that can occur in CCUS processes. Figure 4 shows the amount of C1 present in the aqueous phase for two different CO2 injection contents (10 and 60 mole%). Similar to the behavior of CO2, the solubility of C1 increases with depth and there is no significant change in relation with the amount of water in the system (Figure 4-a,b). It is worth keeping in mind that the soluble amount of methane in water is considerably less compared to that of CO2. At the same injection conditions (40 mole%) and depth (17,000 ft), the methane solubility is 10 scf/bbl while CO2 solubility is around 250 scf/bbl. A big difference with respect to CO2 is that the amount of C1 in the aqueous phase decreases with the greater the amount of gas injected (Figure 4-a,c). This was expected because the methane present in the system is higher for 10% CO2 injection (7 - 21 mole%) compared to 60% (3 - 9 mole%).
CO2 content (GWR) in the aqueous phase predicted by the association schemes for different depths at three different injection contents and two amounts of water. (a) Injection Content (mole%) = 0 and Water Content (mole%) = 25, (b) Injection Content (mole%) = 0 and Water Content (mole%) = 50, (c) Injection Content (mole%) = 40 and Water Content (mole%) = 25, (d) Injection Content (mole%) = 40 and Water Content (mole%) = 50, (e) Injection Content (mole%) = 80 and Water Content (mole%) = 25
C1 content (GWR) in the aqueous phase predicted by the association schemes for different depths at two different injection contents and two amounts of water. (a) Injection Content (mole%) = 10 and Water Content (mole%) = 25, (b) Injection Content (mole%) = 10 and Water Content (mole%) = 50, (c) Injection Content (mole%) = 60 and Water Content (mole%) = 25 and (d) Injection Content (mole%) = 60 and Water Content (mole%) = 50
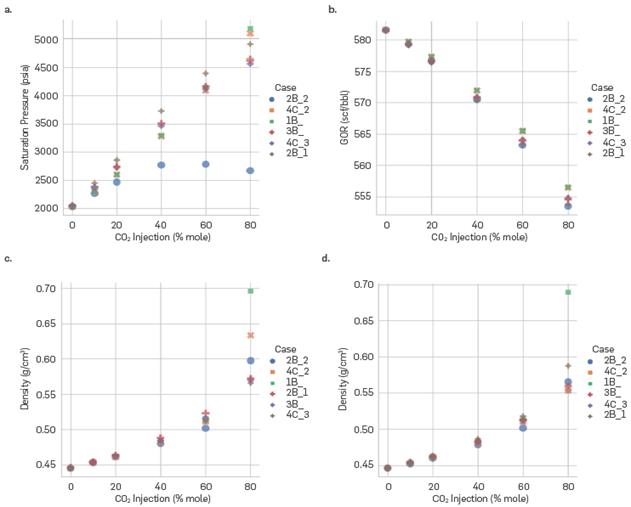
To analyze the swelling processes that occur within the crude oil in Figure 5, saturation pressures, GOR, and oil phase density are shown for the reference depth (15374.2 ft) at different CO2 injection conditions. Different literature studies have reported the increase in saturation pressure when injecting different amounts of CO2 (Arya et al., 2015Arya, A., von Solms, N., & Kontogeorgis, G. M. (2015). Determination of asphaltene onset conditions using the cubic plus association equation of state. Fluid Phase Equilibria, 400, 8-19. https://doi.org/10.1016/j.fluid.2015.04.032
https://doi.org/10.1016/j.fluid.2015.04....
). This behavior is replicated by most of the association schemes used in this study; however, 2B_2 presents thermodynamic inconsistencies at high CO2 contents, as can be seen in Figure 5-a. Hence, as occurred with 4C_1, this scheme is excluded from subsequent analyses. Regarding the GOR, very small changes can be observed with respect to the amount of CO2 injected (Figure 5-b). The case study of this work is a fluid close to the critical point whose density under depletion conditions at the reference depth is approximately 0.45 g/cm3. The CO2 injection conditions (Temperature and Pressure) make this a supercritical fluid with higher densities than the original fluid in the reservoir (greater depths and CO2 injection conditions). As CO2 is solubilized within the original fluid, the density of the latter increases, as a consequence of a greater amount of CO2 present in the oil phase. The phenomenon described above is observed in Figure 5-c,d. In relation with the water content in the system, there are no significant differences in the calculation of the density of the oil phase for % Injection less than or equal to 60%. For 80% contents, association schemes 1B and 4C_2 predict a lower density for systems with a greater amount of water (Figure 5-c,d). As mentioned above, schemes 4C_1 and 2B_2 present inconsistencies in the calculation of properties such as CO2 solubility in water and saturation pressure. It should be highlighted that the SRK equation of state represents the physical component in the context of these two association schemes, while PR was selected as the equation of state for the execution of all simulations. The discrepancy in the selection of EoS to portray the physical aspect is attributed to the widespread adoption of Peng-Robinson as a fundamental framework for numerous fluid models in the industry. In this study, the focus was primarily on the association scheme as the variable of interest, which could elucidate the reasons behind the issues observed in schemes 4C_1 and 2B_2.
Saturation pressure, GOR and density of the oil phase for the reference depth (15374.2 m) at different CO2 injection conditions. (a) Saturation Pressure (psi), (b) Gas - Oil Ratio (GOR), (c) Oil phase density (g/cm3) for 25 mole% water content and (d)
To overcome this drawback, it is possible to adjust the volumes and association energies of those schemes to properly calculate the phase behavior. However, it is important to note that modifying these schemes to accurately represent a singular phenomenon in this type of process, either swelling, solubility in water of formation, or system pressurization, will not correctly describe the others, resulting in new thermodynamic inconsistencies in unadjusted properties.
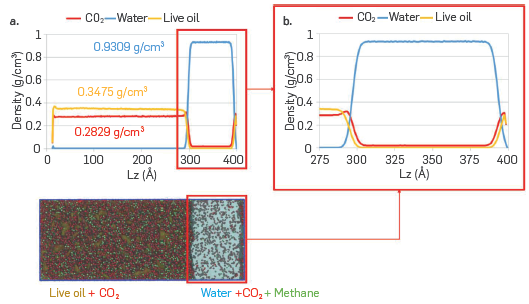
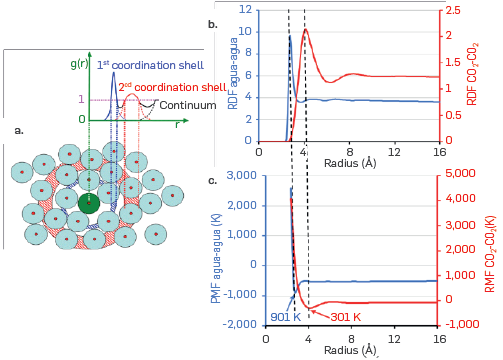
Associative Parameters Molecular dynamics (MD). Figure 6-a shows the final configuration after equilibration of the raw live-CO2-water system from the MD simulation. The results obtained a led to identifying that the CO2 molecules were mainly solubilized with the live crude oil model solution, while a few were located in the aqueous phase. Interestingly, the DM model led to establish that some methane molecules were located in the aqueous phase, while asphaltenes and heptol remained in the region occupied by CO2 and the computational representation of live crude oil. To better visualize this distribution of the species evaluated in the DM model, some fractions were omitted. Figure 6-b only shows the location of the CO2 molecules, allowing the CO2 distribution in the two phases (hydrocarbon and water) to be established more clearly. Figure 6-c shows the location of the aqueous phase and the methane molecules of live crude oil to better illustrate the solubility of methane in water. Finally, in Figure 6-d, the location of the asphaltene molecules (in red) and the aqueous phase is shown, where the majority tends to remain in live crude oil and CO2, locating a single molecule on the interface, but none within the aqueous phase (soluble), although the molecular structure of the type asphaltene used in this study (Figure 2-b), can form hydrogen bonds through the hydroxyl group (OH). In Figure 7, results of the calculation of the density profiles are reported to have a numerical representation of the results reported in Figure 6. The results indicate that there is a reduction in the density of water of approximately 7%, due to the swelling produced by CO2 and methane molecules, soluble in the aqueous phase. The density of the computational representation of live crude oil is only 0.3475 g/cm3 since the matrix of the model solution corresponds to 70:30 heptol, which at ambient conditions has a density of 0.7301 g/cm3. The CO2 density at the simulation conditions (255 °F and 6500 psi) is 0.2829 g/cm3, promoting changes in the density of the live crude oil and, therefore, in the internal structure of the fluid.
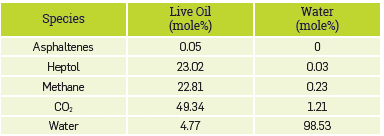
Additionally, through the density profiles, it was possible to identify the interfacial region and to quantify the number of molecules located in each phase (aqueous and live crude oil). Based on these results, the mole compositions are reported in Table 4. proving that these types of computational methods are promising as complementary tools for experimental data to produce reliable data on CO2 solubility and CO2-water/brine interfacial tensions (Javanbakht et al., 2015Javanbakht, G., Sedghi, M., Welch, W., & Goual, L. (2015). Molecular dynamics simulations of CO2/water/quartz interfacial properties: Impact of CO2 dissolution in water. Langmuir, 31(21), 5812-5819. https://doi.org/10.1021/acs.langmuir.5b00445
https://doi.org/10.1021/acs.langmuir.5b0...
), thus providing a detailed understanding of the effect of the interaction of CO2 with reservoir fluids (hydrocarbon and brines).
Mole composition of the species evaluated in the DM model in the aqueous an oil (live crude oil) phase.
Finally, molecular dynamics simulations were used to estimate the water-water and CO2-CO2 association energies. In this case, the radial distribution function (RDF) was calculated, which is widely used in DM modeling as it allows to establish the internal structure of the fluid (Headen et al., 2017Headen, T. F., Boek, E. S., Jackson, G., Totton, T. S., & Müller, E. A. (2017). Simulation of Asphaltene Aggregation through Molecular Dynamics: Insights and Limitations. Energy and Fuels, 31(2), 1108-1125. https://doi.org/10.1021/acs.energyfuels.6b02161
https://doi.org/10.1021/acs.energyfuels....
; Moncayo-Riascos et al., 2021Moncayo-Riascos, I., Lozano, M. M., Hoyos, B. A., Franco, C. A., Riazi, M., & Cortés, F. B. (2021). Physical Insights about Viscosity Differences of Asphaltene Dissolved in Benzene and Xylene Isomers: Theoretical-Experimental Approaches. Energy & Fuels, 35(22), 18574-18582. https://doi.org/10.1021/acs.energyfuels.1c03348
https://doi.org/10.1021/acs.energyfuels....
). Figure 8-a presents a diagram of the RDF calculation, where the green particle represents a reference molecule. This servers to define how e other species of the computational model are distributed, identifying, in the blue region, those molecules located in the first coordination peak. The second coordination peak corresponds to the molecules located in the red region.
(a) Final configuration of the simulation of the live crude-CO2-water system. Equilibrium location of the molecules of (b) CO2, (c) methane and water, and (c) asphaltenes and water. The color legend is the same as reported in Figure 2.
(a) Density profile of the equilibrium configuration of the live crude oil- CO2-water system and (b) zoom over the live crude oil (CO2)-water (CO2) interfacial region highlighted in red boxes. The color legend is the same as reported in Figure 2.
In Figure 8-b, the results obtained from the radial distribution functions between the centers of mass of the water molecules (in blue) and CO2 (in red) are reported. Additionally, using the calculation of the potential mean force (PMF), it is possible to determine the association energies from the determined RDFs. The PMF is equal to the product of the Boltzmann constant and the temperature (-kB * T), multiplied by the natural logarithm of the RDF (Headen et al., 2017Headen, T. F., Boek, E. S., Jackson, G., Totton, T. S., & Müller, E. A. (2017). Simulation of Asphaltene Aggregation through Molecular Dynamics: Insights and Limitations. Energy and Fuels, 31(2), 1108-1125. https://doi.org/10.1021/acs.energyfuels.6b02161
https://doi.org/10.1021/acs.energyfuels....
). Figure 8-c shows association energies determined by DM for water-water (901 K) and CO2-CO2 (301 K) interactions, while the cross-interaction was estimated using a mixing rule (arithmetical average).
(a) Schematic of the calculation of the radial distribution function (RDF), and (b) zoom on the live crude oil (CO2)-water (CO2) interfacial region highlighted in red boxes. The color legend is the same as that reported in Figure 2.
It is worth noting that the interaction energies determined in this study are significantly lower than those reported in the literature for the water-water interaction (2003 K)(Tsivintzelis et al., 2015Tsivintzelis, I., & Kontogeorgis, G. M. (2015). Modelling phase equilibria for acid gas mixtures using the CPA equation of state. Part V: Multicomponent mixtures containing CO2 and alcohols. The Journal of Supercritical Fluids, 104, 29-39. https://doi.org/10.1016/j.supflu.2015.05.015
https://doi.org/10.1016/j.supflu.2015.05...
b). Considering that there is no detailed description in the literature of how the association energies were obtained, this approach may be promising in acquiring association parameters with a physical description of the interactions through computational MD modeling. From the determined association energies, it is possible to find the association volumes necessary to appropriately describe the experimental data. In this study, CO2 solubility data in water was used(Valtz et al., 2004Valtz, A., Chapoy, A., Coquelet, C ., Paricaud, P. , & Richon, D. (2004). Vapour-liquid equilibria in the carbon dioxide-water system, measurement and modelling from 278.2 to 318.2 K. Fluid phase equilibria, 226, 333-344. https://doi.org/10.1016/j.fluid.2004.10.013
https://doi.org/10.1016/j.fluid.2004.10....
), to adjust the association volume, finding that the association volume is 0.332 and 0.184 m3/mole, for the water-water and CO2-water interaction respectively. The association volumes obtained are significantly higher than those reported in the literature (0.01 to 0.05 m3/mole) (Arya et al., 2016Arya, A., Von Solms, N., & Kontogeorgis, G. M. (2016). Investigation of the Gas Injection Effect on Asphaltene Onset Precipitation Using the Cubic-Plus-Association Equation of State. Energy and Fuels, 30(5), 3560-3574. https://doi.org/10.1021/acs.energyfuels.5b01874
https://doi.org/10.1021/acs.energyfuels....
; Z. Li & Firoozabadi, 2010Li, Z., & Firoozabadi, A. (2010). Cubic-plus-association equation of state for asphaltene precipitation in live oils. Energy & Fuels, 24(5), 2956-2963. https://doi.org/10.1021/ef9014263
https://doi.org/10.1021/ef9014263...
; Nascimento et al., 2019Nascimento, F. P., Costa, G. M. N., & Vieira de Melo, S. A. B. (2019). A comparative study of CPA and PC-SAFT equations of state to calculate the asphaltene onset pressure and phase envelope. Fluid Phase Equilibria, 494, 74-92. https://doi.org/10.1016/j.fluid.2019.04.027
https://doi.org/10.1016/j.fluid.2019.04....
). This is because, having lower association energies, the association volume must be greater to adequately describe the solubility of CO2 in water. This means that, for lower association energies, the influence distance at which the molecules can be considered associated must be greater. Typically, the association volumes used to describe the association of asphaltene compounds is 0.05 m3/mol. Therefore, it makes physical sense to consider that the volume of association between water molecules is greater, since the region of influence of water molecules is much larger than that of asphaltenes, due to long-range electrostatic energies. This type of interaction has a fundamental role in describing the behavior of the aqueous phase, as because of it, water (18 g/mole) at ambient conditions is in the liquid phase, while molecules of higher molecular weight such as CO2 (44 g/mole) are in the gas phase at the same conditions.
Comparison of Associative Parameters Literature and Molecular Dynamics (MD). Once the association energies between water and CO2 have been obtained through molecular dynamics, and the association volumes have been adjusted to experimental solubility data(Valtz et al., 2004Valtz, A., Chapoy, A., Coquelet, C ., Paricaud, P. , & Richon, D. (2004). Vapour-liquid equilibria in the carbon dioxide-water system, measurement and modelling from 278.2 to 318.2 K. Fluid phase equilibria, 226, 333-344. https://doi.org/10.1016/j.fluid.2004.10.013
https://doi.org/10.1016/j.fluid.2004.10....
), a new association scheme called 1B_DM is defined. It was decided to work with scheme 1B for CO2 (CO2 molecules do not associate with each other) because it is the most worked on in literature in recent years, as mentioned in the introduction. In turn, the water association scheme remains as 4C. Using the 1B_DM scheme and the EoS CPA, the different CO2 injection scenarios in the case study compositional fluid are simulated. Additionally, a comparison is made between the Molecular Dynamics scheme and the literature schemes.
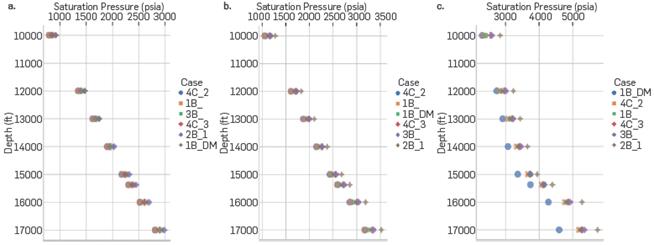
Figure 9 shows the saturation pressures calculated using the EoS CPA for the different Literature Association and DM schemes. As can be seen, the 1B_DM scheme correctly represents the directly proportional relationship existing between saturation pressure, CO2 injection percentage, and depth. Both the literature and DM schemes present similar results at low injection conditions; however, as the amount of CO2 in the system increases, the schemes predict different saturation pressures, observing a greater deviation towards the base of the formation.
Saturation pressure CO2-Water-Hydrocarbon System at different depths for CO2 Injected at (a) 10, (b) 20 and (c) 60 mole%
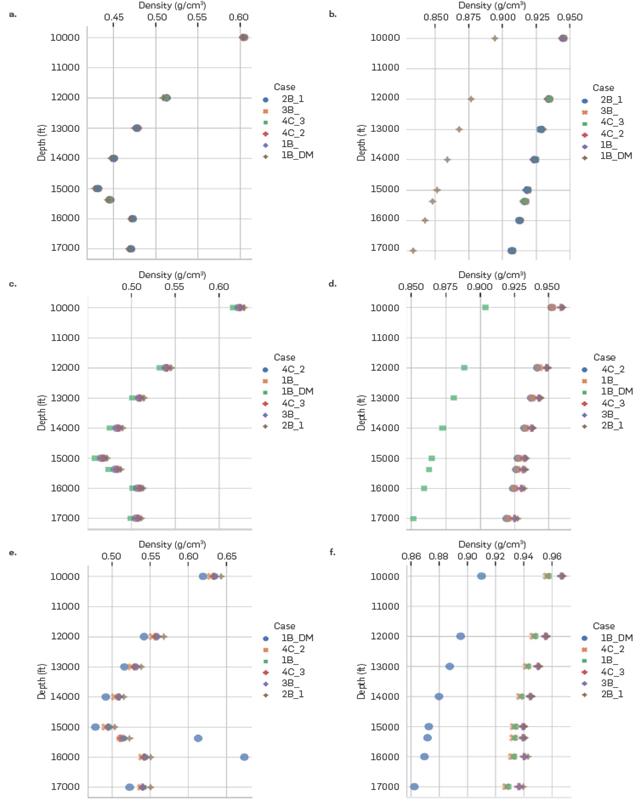
As discussed earlier, the density of the oil is greater as the amount of CO2 injected into the system is increased and this behavior is appropriately described by the 1B_DM scheme (Figure 10-a,c,e). However, compared to literature schemes, a sudden increase in crude oil density for depths 15374.2 and 16000ft is predicted for high CO2 contents, as illustrated in Figure 10-e. This change in density does not have a clear explanation, since there is no sudden change in trend in the CO2 content in the oil phase between 40 and 60% injection throughout the vertical relief (Figure 11). About to the aqueous phase (Figure 10-b,d,f), the trend of direct proportionality between the amount of CO2 injected and its density is correctly represented with the different association schemes. However, it is worth noting that these changes are less than 2%. It can also be observed that the densities obtained by the DM association scheme are lower compared to those obtained from literature schemes.
Density (g/cm3) at different depths for (a) Oil Phase at 0 mole% of CO2 Injected, (b) Aqueous Phase at 0 mole% of CO2 Injected, (c) Oil Phase at 40 mole% of CO2 Injected, (d) Aqueous Phase at 40 mole% of CO2 Injected, (e) Oil Phase at 60 mole% of CO2
Mole fraction of CO2 in the oil phase for different CO2 injections at the (a) top (10,000 ft) and (b) bottom (17,000 ft) of the formation
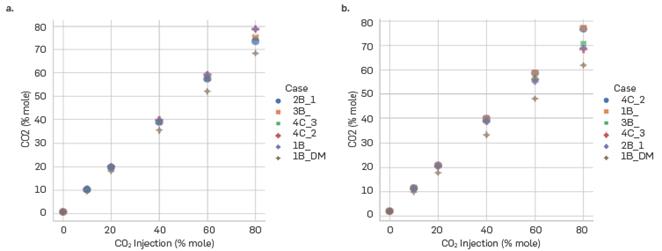
The association scheme obtained from DM represents the increase in the CO2 content in the crude oil with the amount of CO2 injected into the system. Similar values of carbon dioxide present in the oil phase are calculated for injections less than 40%. However, at higher injections, there is a change in the CO2 content for the systems that are located at the crest of the formation (10,000 ft) or in the valley of the formation (17,000 ft), as can be seen in Figure 11. It is important to note that all association schemes, including those extracted from literature, show the behavior described above. For 60% of CO2 injected, the mole fraction at the top is 0.52 while at the bottom is 0.48 and. Also, for 80% of CO2 injected, this difference is even greater, going from 0.69 at the top of the formation to 0.61 at the bottom. Although in theory they may be seen as small differences, these have a significant impact on important properties such as density and viscosity. It is important to note that even the association schemes extracted from literature also show the behavior described above.
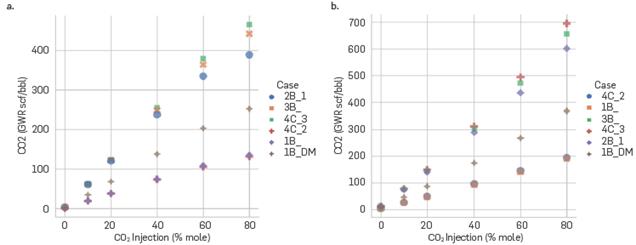
Finally, to quantify the amount of CO2 that can be solubilized in the aqueous phase, the mole fraction of CO2 in water is calculated (later transformed into GWR) at two specific depths with amounts of CO2 injected between 10 and 80 mole% using the different association schemes and the EoS CPA. First, the CO2 content in the aqueous phase depends greatly on the association scheme with high injected CO2 contents, a situation not applicable for properties such as oil density, water density (except the 1B_DM scheme), and saturation pressure. For 80 mole% injection, the solubility of CO2 at the top (Figure 12-a) varies between 120 and 450 scf/bbl, while at the bottom, this range of variation is even greater, obtaining values of 200 to 700 scf/bbl (Figure 12-b). On the other hand, the predictions made by the DM association scheme are within the range of those calculated by the literature schemes, which makes it possible to demonstrate the coherence of the DM model to determine this type of properties. In theory, having such high CO2 contents in water is not feasible (greater than 130 scf/bbl); however, until experimental data is available to corroborate these results, it is not possible to rule out any of the schemes studied except for cases 4C_1 and 2B_2, which showed thermodynamic inconsistencies in the calculation of basic properties.
CO2 content (GWR) in the aqueous phase for different amounts of CO2 injection at the (a) top (10000 ft) and (b) bottom (17000 ft) of the formation
Accurately characterizing the phase behavior of CO2-hydrocarbon- water systems across various temperature and pressure ranges is crucial for understanding the diverse phenomena observed in CO2 injection EOR-storage processes. These phenomena include the effective displacement of oil by CO2, the detrimental impact of viscous and gravitational fingering on hydrocarbon recovery, and the potential assistance in carbon sequestration within aquifers. The research conducted allows for an accurate depiction of the phase equilibria observed in the different systems examined. The complexity of this task arises from the wide range of temperature and pressure conditions, as well as the asymmetric composition of the mixtures studied. Furthermore, the presence of polar compounds with strong associative interactions adds complexity to the description of the phase equilibria in these systems. Nonetheless, the utilization of the CPA equation appropriately represents these phenomenon.
Therefore, a comprehensive understanding of the phase behavior is essential to design and optimize these processes to achieve desired outcomes. Other key parameters, such as crude oil composition and reservoir conditions, will be analyzed in future works.
This is the first time that Ecopetrol has used an advanced equation of state with the aforementioned scope, which is an important milestone in the acquisition of technical competencies and incorporation of technologies required to support the Ecopetrol Group's strategy.
CONCLUSIONS
Using CPA EoS and 8 different association schemes (7 from literature and 1 from DM), the thermodynamic behavior of CO2, water and hydrocarbon systems was studied in a CO2 injection process (10 - 80 mole%) and water content (25 and 50 mole%) for a case study of a depleted reservoir in Colombia. The evaluation was performed based on variables such as Gas - Oil Ratio (GOR - scf/bbl), crude oil and water density for swelling processes, Gas - Water Ratio (GWR - scf/ bbl) of CO2 and C1 to quantify solubilities and saturation pressures to estimate the pressurization of the different systems.
Association schemes 4C_1 and 2B_2 presented thermodynamic problems for the calculation of properties such as solubility and saturation pressures, as they showed unphysically trends in CO2 injection processes. However, it is possible to adjust the volumes and association energies of the schemes to properly calculate the phase behavior.
The literature schemes, with the exception of those mentioned above, correctly represent thermodynamic behavior of water-CO2-hydrocarbon systems in CCUS processes, whether they are swelling phenomena, CO2 and C1 solubility in formation water or system pressurization.
The molecular dynamics computational model developed allowed us to establish an initial approach to understand the interaction of CO2 with a model solution of a living crude oil (heptol+asphaltenes+methane) and water. The results obtained satisfactorily describe the distribution and solubility of CO2 in the hydrocarbon phase and water. The mole fractions, determined through the computational model, are within the expected range for this type of systems, indicating that the potential use of this type of advanced modeling tools that allows reliable data and understanding the phenomena from a computational point of view involved in CCUS processes. Additionally, the water-water and CO2-CO2 association energies were determined.
In general, the association scheme determined from DM presents results in accordance with those expected physically, which is corroborated when comparing the different properties determined with this scheme and those from the literature.
This work is a guide for the acquisition of experimental data of CO2-water-hydrocarbon systems and technical competencies, plus the incorporation of technologies required to support the CCUS projects in the future and Ecopetrol Group's strategy.
ACKNOWLEDGEMENTS
The authors want to express their gratitude to Meridian Consulting, Ecopetrol S.A., SGS Consulting and Universidad Nacional de Colombia at Medellin for their support during execution of this project.
REFERENCES
- Al Ghafri, S. Z., & Trusler, J. P. M. (2019). Phase equilibria of (Methylbenzene + Carbon dioxide + Methane) at elevated pressure: Experiment and modelling. Journal of Supercritical Fluids, 145. 1-9. https://doi.org/10.1016/j.supflu.2018.11.012
» https://doi.org/10.1016/j.supflu.2018.11.012 - Arya, A., von Solms, N., & Kontogeorgis, G. M. (2015). Determination of asphaltene onset conditions using the cubic plus association equation of state. Fluid Phase Equilibria, 400, 8-19. https://doi.org/10.1016/j.fluid.2015.04.032
» https://doi.org/10.1016/j.fluid.2015.04.032 - Arya, A., Von Solms, N., & Kontogeorgis, G. M. (2016). Investigation of the Gas Injection Effect on Asphaltene Onset Precipitation Using the Cubic-Plus-Association Equation of State. Energy and Fuels, 30(5), 3560-3574. https://doi.org/10.1021/acs.energyfuels.5b01874
» https://doi.org/10.1021/acs.energyfuels.5b01874 - Avendaño, C., Lafitte, T., Galindo, A., Adjiman, C. S., Jackson, G., & Müller, E. A. (2011). SAFT-H force field for the simulation of molecular fluids. 1. A single-site coarse grained model of carbon dioxide. Journal of Physical Chemistry B, 115(38), 11154-11169. https://doi.org/10.1021/jp204908d
» https://doi.org/10.1021/jp204908d - Baklid, A., Korbol, R., & Owren, G. (1996, October). Sleipner Vest CO2 disposal, CO2 injection into a shallow underground aquifer. In SPE Annual Technical Conference and Exhibition? (pp. SPE-36600). SPE. https://doi.org/10.2118/36600-MS
» https://doi.org/10.2118/36600-MS - Bian, X. Q., Xiong, W., Kasthuriarachchi, D. T. K., & Liu, Y. B. (2019). Phase equilibrium modeling for carbon dioxide solubility in aqueous sodium chloride solutions using an association equation of state. Industrial and Engineering Chemistry Research, 58(24). 10570-10578. https://doi.org/10.1021/acs.iecr.9b01736
» https://doi.org/10.1021/acs.iecr.9b01736 - Bjørner, M. G. (2016). Thermodynamic modeling of CO2 mixtures. https://orbit.dtu.dk/files/128129274/Thesis_mgabj_final.pdf
» https://orbit.dtu.dk/files/128129274/Thesis_mgabj_final.pdf - Bjørner, M. G., & Kontogeorgis, G. M. (2016). Modeling derivative properties and binary mixtures with CO2 using the CPA and the quadrupolar CPA equations of state. Fluid Phase Equilibria, 408, 151-169. https://doi.org/10.1016/j.fluid.2015.08.011
» https://doi.org/10.1016/j.fluid.2015.08.011 - Chabab, S., Théveneau, P., Corvisier, J., Coquelet, C Paricaud, P., Houriez, C., & Ahmar, E. El. (2019). Thermodynamic study of the CO2 - H2O - NaCl system: Measurements of CO2 solubility and modeling of phase equilibria using Soreide and Whitson, electrolyte CPA and SIT models. International Journal of Greenhouse Gas Control, 91. 102825. https://doi.org/10.1016/j.ijggc.2019.102825
» https://doi.org/10.1016/j.ijggc.2019.102825 - Chen, Z., Zhou, Y., & Li, H. (2022). A Review of Phase Behavior Mechanisms of CO2 EOR and Storage in Subsurface Formations. Industrial and Engineering Chemistry Research, 61(29), 10298-10318. https://doi.org/10.1021/acs.iecr.2c00204
» https://doi.org/10.1021/acs.iecr.2c00204 - Danten, Y., Tassaing, T., & Besnard, M. (2005). Ab initio nvestigation of vibrational spectra of water-(CO2) n complexes (n= 1, 2). The Journal of Physical Chemistry A, 109(14), 3250-3256. https://doi.org/10.1021/jp0503819
» https://doi.org/10.1021/jp0503819 - Dufal, S., Papaioannou, V., Sadeqzadeh, M., Pogiatzis, T., Chremos, A., Adjiman, C. S.....& Galindo, A. (2014). Prediction of thermodynamic properties and phase behavior of fluids and mixtures with the SAFT-H Mie group-contribution equation of state. Journal of Chemical & Engineering Data, 59(10), 3272-3288. https://doi.org/10.1021/je500248h
» https://doi.org/10.1021/je500248h - Ennis-King, J., & Paterson, L. (2002, October). Engineering aspects of geological sequestration of carbon dioxide. In SPE Asia Pacific Oil and Gas Conference and Exhibition (pp. SPE-77809). SPE. https://doi.org/10.2523/77809-MS
» https://doi.org/10.2523/77809-MS - Headen, T. F., Boek, E. S., Jackson, G., Totton, T. S., & Müller, E. A. (2017). Simulation of Asphaltene Aggregation through Molecular Dynamics: Insights and Limitations. Energy and Fuels, 31(2), 1108-1125. https://doi.org/10.1021/acs.energyfuels.6b02161
» https://doi.org/10.1021/acs.energyfuels.6b02161 - Herdes, C., Totton, T. S., & Müller, E. A. (2015). Coarse grained force field for the molecular simulation of natural gases and condensates. Fluid Phase Equilibria, 406, 91100. https://doi.org/10.1016/j.fluid.2015.07.014
» https://doi.org/10.1016/j.fluid.2015.07.014 - Hockney, R. W. 0, & Eastwood, J. W. (1988). Computer Simulation Using Particles (A. Hilger, Ed.). https://doi.org/10.1201/9780367806934
» https://doi.org/10.1201/9780367806934 - Houoway, S., & Survey, B. G. (1993). The potential for aquider disposal of carbon dioxide in the UK. Energy Conversion and Management, 34(9-11), 925-932. https://doi.org/10.1016/0196-8904(93)90038-C
» https://doi.org/10.1016/0196-8904(93)90038-C - Huang, S. H., & Radosz, M. (1990). Equation of state for small, large, polydisperse, and associating molecules. Industrial & Engineering Chemistry Research, 29(11), 2284-2294. https://doi.org/10.1021/ie00107a014
» https://doi.org/10.1021/ie00107a014 - IEA. (2008). Energy technology perspective. Scenario and strategies to 2050. In Strategies (Issue June). https://iea.blob.core.windows.net/assets/0e190efb-daec-4116-9ff7-ea097f649a77/etp2008.pdf
» https://iea.blob.core.windows.net/assets/0e190efb-daec-4116-9ff7-ea097f649a77/etp2008.pdf - Javanbakht, G., Sedghi, M., Welch, W., & Goual, L. (2015). Molecular dynamics simulations of CO2/water/quartz interfacial properties: Impact of CO2 dissolution in water. Langmuir, 31(21), 5812-5819. https://doi.org/10.1021/acs.langmuir.5b00445
» https://doi.org/10.1021/acs.langmuir.5b00445 - Jindrova, T., Mikyška, J., & Firoozabadi, A. (2016). Phase behavior modeling of bitumen and light normal alkanes and CO2 by PR-EOS and CPA-EOS. Energy & Fuels, 30(1), 515-525. https://doi.org/10.1021/acs.energyfuels.5b02322
» https://doi.org/10.1021/acs.energyfuels.5b02322 - Larsen, B., Rasaiah, J. C., & Stell, G. (1977). Thermodynamic perturbation theory for multipolar and onic liquids. Molecular Physics, 33(4), 987-1027. https://doi.org/10.1080/00268977700100901
» https://doi.org/10.1080/00268977700100901 - Li, J., Topphoff, M., Fischer, K., & Gmehling, J. (2001). Prediction of gas solubilities in aqueous electrolyte systems using the predictive Soave- Redlich- Kwong model. Industrial & engineering chemistry research, 40(16), 3703-3710. https://doi.org/10.1021/ie0100535
» https://doi.org/10.1021/ie0100535 - Li, Z., & Firoozabadi, A. (2010). Cubic-plus-association equation of state for asphaltene precipitation in live oils. Energy & Fuels, 24(5), 2956-2963. https://doi.org/10.1021/ef9014263
» https://doi.org/10.1021/ef9014263 - Martinsen, S. 0., Castiblanco, L., Osorio, R., & Whitson, C. H. (2010, September). Advanced Fluid Characterization of Pauto Complex, Colombia. In SPE Annual Technical Conference and Exhibition? (pp. SPE-135085). SPE. https://doi.org/10.2118/135085-MS
» https://doi.org/10.2118/135085-MS - Moncayo-Riascos, I., Lozano, M. M., Hoyos, B. A., Franco, C. A., Riazi, M., & Cortés, F. B. (2021). Physical Insights about Viscosity Differences of Asphaltene Dissolved in Benzene and Xylene Isomers: Theoretical-Experimental Approaches. Energy & Fuels, 35(22), 18574-18582. https://doi.org/10.1021/acs.energyfuels.1c03348
» https://doi.org/10.1021/acs.energyfuels.1c03348 - Moncayo-Riascos, I., Rojas-Ruiz, F. A., Orrego-Ruiz, J. A., Cundar, C., Torres, R. G., & Cañas-Marín, W. (2022). Reconstruction of a synthetic crude oil using petroleomics and molecular dynamics simulations: A multistructural approach to understanding asphaltene aggregation behavior. Energy & Fuels, 36(2), 837-850. https://doi.org/10.1021/acs.energyfuels.1c03497
» https://doi.org/10.1021/acs.energyfuels.1c03497 - Monteiro, M. F., Moura-Neto, M. H., Pereira, C. G., & Chiavone-Filho, O. (2020). Description of phase equilibrium and volumetric properties for CO2+water and CO2+ethanol using the CPA equation of state. Journal of Supercritical Fluids, 161, 104841. https://doi.org/10.1016/j.supflu.2020.104841
» https://doi.org/10.1016/j.supflu.2020.104841 - Nascimento, F. P., Costa, G. M. N., & Vieira de Melo, S. A. B. (2019). A comparative study of CPA and PC-SAFT equations of state to calculate the asphaltene onset pressure and phase envelope. Fluid Phase Equilibria, 494, 74-92. https://doi.org/10.1016/j.fluid.2019.04.027
» https://doi.org/10.1016/j.fluid.2019.04.027 - Nasrabadi, H., Moortgat, J., & Firoozabadi, A. (2016). New three-phase multicomponent compositional model for asphaltene precipitation during CO2 injection using CPA-EOS. Energy & Fuels, 30(4), 3306-3319. https://doi.org/10.1021/acs.energyfuels.5b02944
» https://doi.org/10.1021/acs.energyfuels.5b02944 - Negahban, S., Kazemi, M., Kalantari, M., Dindoruk, B., & Elshahawi, H. (2020). "Digital Fluid Physics": Prediction of phase equilibria for several mixtures of CO2 with petroleum fluid systems. Journal of Petroleum Science and Engineering, 187, 106752. https://doi.org/10.1016/j.petrol.2019.106752
» https://doi.org/10.1016/j.petrol.2019.106752 - Oliveira, M. B., Queimada, A. J., Kontogeorgis, G. M., & Coutinho, J. A. P. (2011). Evaluation of the CO2 behavior in binary mixtures with alkanes, alcohols, acids and esters using the Cubic-Plus-Association Equation of State. Journal of Supercritical Fluids, 55(3), 876-892. https://doi.org/10.1016/j.supflu.2010.09.036
» https://doi.org/10.1016/j.supflu.2010.09.036 - Papaioannou, V. , Calado, F., Lafitte, T., Dufal, S. , Sadeqzadeh, M. , Jackson, G..... & Galindo, A. (2016). Application of the SAFT-H Mie group contribution equation of state to fluids of relevance to the oil and gas industry. Fluid Phase Equilibria, 416, 104-119. https://doi.org/10.1016/j.fluid.2015.12.041
» https://doi.org/10.1016/j.fluid.2015.12.041 - Péneloux, A., Rauzy, E., & Fréze, R. (1982). A consistent correction for Redlich-Kwong-Soave volumes. Fluid Phase Equilibria, 8(1), 7-23. https://doi.org/10.1016/0378-3812(82)80002-2
» https://doi.org/10.1016/0378-3812(82)80002-2 - Peng, D.-Y., & Robinson, D. B. (1976). A new two-constant equation of state. Industrial & Engineering Chemistry Fundamentals, 15(1), 59-64. https://doi.org/10.1021/i160057a011
» https://doi.org/10.1021/i160057a011 - Plimpton, S. (1995). Fast Parallel Algorithms for Short - Range Molecular Dynamics. Journal of Computational Physics, 117, 1-19. https://doi.org/10.1006/jcph.1995.1039
» https://doi.org/10.1006/jcph.1995.1039 - Ramírez, L., Moncayo-Riascos, I., Cortés, F. B., Franco, C. A., & Ribadeneira, R. (2021). Molecular dynamics study of the aggregation behavior of polycyclic aromatic hydrocarbon molecules in n-heptane-toluene mixtures: Assessing the heteroatom content effect. Energy and Fuels, 35(4), 3119-3129. https://doi.org/10.1021/acs.energyfuels.0c04153
» https://doi.org/10.1021/acs.energyfuels.0c04153 - Sanchez-Vicente, Y., Tay, W. J., Al Ghafri, S. Z., & Trusler, J. M. (2018). Thermodynamics of carbon dioxide-hydrocarbon systems. Applied Energy, 220, 629-642. https://doi.org/10.1016/j.apenergy.2018.03.136
» https://doi.org/10.1016/j.apenergy.2018.03.136 - Sun, X., Wang, Z., Li, H., He, H., & Sun, B. (2021). A simple model for the prediction of mutual solubility in CO2-brine system at geological conditions. Desalination, 504, 114972. https://doi.org/10.1016/j.desal.2021.114972
» https://doi.org/10.1016/j.desal.2021.114972 - Tsivintzelis, I., Ali, S., & Kontogeorgis, G. M. (2015). Modeling phase equilibria for acid gas mixtures using the CPA equation of state. Part IV. Applications to mixtures of CO2 with alkanes. Fluid Phase Equilibria, 397, 1-17. https://doi.org/10.1016/j.fluid.2015.03.034
» https://doi.org/10.1016/j.fluid.2015.03.034 - Tsivintzelis, I., & Kontogeorgis, G. M. (2015). Modelling phase equilibria for acid gas mixtures using the CPA equation of state. Part V: Multicomponent mixtures containing CO2 and alcohols. The Journal of Supercritical Fluids, 104, 29-39. https://doi.org/10.1016/j.supflu.2015.05.015
» https://doi.org/10.1016/j.supflu.2015.05.015 - Tsivintzelis, I., Kontogeorgis, G. M., Michelsen, M. L., & Stenby, E. H. (2011). Modeling phase equilibria for acid gas mixtures using the CPA equation of state. Part II: Binary mixtures with CO2 Fluid Phase Equilibria, 306(1), 38-56. https://doi.org/10.1016/j.fluid.2011.02.006
» https://doi.org/10.1016/j.fluid.2011.02.006 - Valtz, A., Chapoy, A., Coquelet, C ., Paricaud, P. , & Richon, D. (2004). Vapour-liquid equilibria in the carbon dioxide-water system, measurement and modelling from 278.2 to 318.2 K. Fluid phase equilibria, 226, 333-344. https://doi.org/10.1016/j.fluid.2004.10.013
» https://doi.org/10.1016/j.fluid.2004.10.013 - Van der Meer, L. G. H. (1993). The conditions limiting CO2 storage in aquifers. Energy Conversion and Management, 34(9-11), 959-966. https://doi.org/10.1016/0196-8904(93)90042-9
» https://doi.org/10.1016/0196-8904(93)90042-9 - Van Der Meer, L. G. H., Van der Straaten, R., & Griffioen, J. (1995). Storage of carbon dioxide in aquifers in The Netherlands . In Studies in Environmental Science (Vol. 65, pp. 1099-1104). Elsevier. https://doi.org/10.1016/S0166-1116(06)80133-0
» https://doi.org/10.1016/S0166-1116(06)80133-0 - Van Rooijen, W. A., Habibi, P., Xu, K., Dey, P., Vlugt, T. J. H., Hajibeygi, H., & Moultos, O. A. (2023). Interfacial tensions, solubilities, and transport properties of the H2/ H2O/NaCl system: A molecular simulation study. Journal of Chemical & Engineering Data, 69(2), 307-319. https://doi.org/10.1021/acs.jced.2c00707
» https://doi.org/10.1021/acs.jced.2c00707 - William, H. (1996). VMD-visual molecular dynamics. Journal of molecular graphics, 14, 33-38. https://doi.org/10.1016/0263-7855(96)00018-5
» https://doi.org/10.1016/0263-7855(96)00018-5 - Yang, Y., Chaisoontornyotin, W., & Hoepfner, M. P. (2018). Structure of asphaltenes during precipitation investigated by ultra-small-angle x-ray scattering Langmuir, 34(35), 10371-10380. https://doi.org/10.1021/acs.langmuir.8b01873
» https://doi.org/10.1021/acs.langmuir.8b01873
AUTHORS
| Juan David Aristizábal Marulanda |
Affiliation: Meridian Consulting LTDA, Bogotá, Colombia ORCID: 0009-0004-9170-6777 E-mail: juanda.aristizabal@ecopetrol.com.co |
| Cristiam David Cundar Paredes |
Affiliation: Ecopetrol S.A., Bogotá, Colombia
ORCID: 0009-0005-0737-3226 E-mail: cristiam.cundar@ecopetrol.com.co |
| Christian David Guerrero Benavides |
Affiliation: SGS Consulting, Bogotá, Colombia ORCID: 0009-0001-9566-3872 E-mail: christia.guerrero@ecopetrol.com.co |
| Andrés Aguirre |
Affiliation: Universidad Nacional de Colombia, Sede Medellín
ORCID: 0000-0002-1675-0725 E-mail: anaguirregi@unal.edu.co |
| Juan Andrés Pasos |
Affiliation: Universidad Nacional de Colombia, Sede Medellín
ORCID: 0009-0001-7020-4426 E-mail: japasosr@unal.edu.co |
| Iván Darío Moncayo Riascos |
Affiliation: Meridian Consulting, Bogotá, Colombia ORCID: 0000-0002-1601-3493 E-mail: ivan.moncayo@ecopetrol.com.co |
| Marco Ruiz |
Affiliation: Universidad Nacional de Colombia, Sede Medellín
ORCID: 0000-0002-1372-7925 E-mail: maruiz@unal.edu.co |
| Pedro Nel Benjumea Hernández |
Affiliation: Universidad Nacional de Colombia, Sede Medellín
ORCID: 0000-0002-3490-7845 E-mail: pbenjume@unal.edu.co |
| William Agudelo Zambrano |
Affiliation: Ecopetrol S.A. – Instituto Colombiano del Petróleo (ICP), Piedecuesta, Santander, Colombia
ORCID: 0000-0003-4086-878X E-mail: william.agudelo@ecopetrol.com.co |
| Raúl Osorio Gallego |
Affiliation: Ecopetrol S.A., Bogotá, Colombia
ORCID: 0009-0008-2803-548X E-mail: Raul.Osorio@ecopetrol.com.co |
-
How to cite:
Aristizabal et. al. (2024). Modeling phase equilibria for a water-CO2-hydrocarbon mixture using CPA equation of state in CO2 injection EOR-Storage processes: a Colombian case study. Ciencia, Tecnología y Futuro - CT&F. Vol 14(1). 61 - 76
Publication Dates
-
Date of issue
Jan-Jun 2024
History
-
Received
17 Oct 2023 -
Reviewed
14 Aug 2024 -
Accepted
15 Aug 2024