Assessment of CO2 storage capacity and high-quality corridors for potential CCS projects in the central part of the VMM basin, Colombia
EVALUACIÓN DE LA CAPACIDAD DE ALMACENAMIENTO DE CO2 Y CORREDORES DE CON MEJOR CALIDAD PARA POSIBLES PROYECTOS DE CCS EN LA PARTE CENTRAL DE LA CUENCA VMM, COLOMBIA
Eduardo López Ramos 1, Helber Cubillos Gutierrez 1, Felipe Medellín 3, Alcide Thebault 2
1ECOPETROL - Gerencia Centro Técnico de Desarrollo
2BEICIP-IFP, Houston, TX, 3Halliburton. Houston, TX
e-mail: eduardo.lopezra@ecopetrol.com.co
(Received: Apr 1, 2024; Revised: Mar 19, 2025; Accepted: Mar 31, 2025)
DOI: https://doi.org/10.29047/01225383.770
ABSTRACT
There are numerous industrial processes and energy generators that emit CO2 into the atmosphere, which are still in an incipient state of technological transition for their reduction. A global expanding alternative involves storing CO2 for long periods (> 1,000 years), in geological environments such as saline aquifers. Thus, studies on a semi-regional scale are fundamental to reduce the uncertainty regarding location of sites with the best storage capacities and high Chance of Successful. The use of Forward Stratigraphic Modeling (FSM) workflows to populate static models with properties is a time-versatile tool to evaluate the prospectivity of subsurface resources over large areas, as required for CO2 storage. These workflows, coupled to Common Risk Segment Analysis, have been applied in a basin with a long history of O&G exploration and production, the Middle Magdalena Valley basin in Colombia, proving their effectiveness in the selection of areas along prospective corridors to store CO2, in Mesozoic and Cenozoic formations. Preliminary estimates suggest that the Meso-Cenozoic formations in this part of the basin may reach a Theoretical CO2 Storage Capacity close to 830 GTon CO2 and an Effective CO2 Storage Capacity of 293 GTon CO2.
Keywords: Forward Stratigraphic Modeling, static model, storage capacity, CO2, Common Risk Segment, Middle Magdalena Valley
How to cite:. Lopez, E., Cubillos, H., Medellín, F., Thebault, A. (2025). Assessment of CO2 storage capacity and high-quality corridors for potential ccs projects in the central part of the VMM basin, Colombia. CT&F- Ciencia, Tecnología y Futuro,15 (1), xx-xx. https://doi.org/10.29047/01225383.770
RESUMEN
Son numerosos los procesos industriales y generadores de energía que emiten CO2 a la atmosfera, aún en un estado incipiente de transición tecnológica para lograr disminuirlas. Una alternativa en crecimiento global es almacenar el CO2 por periodos de tiempo prolongados (> 1,000 años), en medios geológicos como acuíferos salinos. Es así como realizar estudios a escala semiregional es una tarea básica para reducir la incertidumbre en la ubicación de sitios con las mejores capacidades de almacenamiento y las mejores probabilidades de éxito. El uso de flujos de trabajo de modelado estratigráfico anticipado (FSM), para poblar con propiedades modelos estáticos, es una herramienta versátil en tiempos para lograr evaluar la prospectividad de recursos del subsuelo en grandes áreas, como es requerido para el almacenamiento de CO2. Estos flujos de trabajo combinados con análisis de segmentos de riesgo común han sido aplicados en una cuenca con gran historia exploratoria y de producción de O&G como lo es la parte central de la cuenca Valle Medio del Magdalena de Colombia, logrando probar su efectividad en la selección de áreas a lo largo de corredores prospectivos para almacenar CO2, en formaciones del Mesozoico y Cenozoico. Estimaciones preliminares sugieren que las formaciones Meso-Cenozoicas en esta parte de la cuenca pueden alcanzar una Capacidad Teórica de Almacenamiento de CO2 cercana a 830 GTon CO2 y la Capacidad Efectiva de Almacenamiento de CO2 alcanza 293 GTon CO2.
Palabras Clave: modelado estratigráfico anticipado, modelo estático, capacidad de almacenamiento, CO2, segmentos de riesgo común, Valle Medio del Magdalena
1. INTRODUCTION
Unpredictable changes in the environment and discrete increases in sea level, atmospheric temperatures and floods coincide with increasing greenhouse gas emissions that, if left unconstrained, can lead to irreversible and unmanageable scenarios. (Javaid, et al. 2022). The global trend of CO2 emissions into the atmosphere is incremental; just starting in 2022, industrial and energy processes through combustion increased by 0.9% (equivalent to 321 MegaTon), reaching a new historical maximum value of 38.8 GigaTon (International Energy Agency 2023). Given this trend, CO2 capture, and storage (CCS) constitutes a technological bridge that contributes to mitigating climate change (Directive 2009/31 2009). Currently, O&G companies carry out projects to reduce their CO2 emissions into the atmosphere in Colombia, including the alternative of storage in geological media. CO2 reduction strategies project to capture around 2 MTonCO2/year with a 110 million Cubic Feet per Day (MMscf/d) starting in 2030, from sources such as refineries located in the central part of the Middle Magdalena Valley basin (MMV). These quantities of captured CO2 make it necessary to look for storage sites with sufficient capacity to inject, store and contain it safely for long periods of time.
The most common geological environments for CO2 storage activities are reservoirs in depleted O&G fields, deep unmineable coal seams, deep saline aquifers, and basaltic formations (USDOE, OFE, NETL 2008). In reservoirs, CO2 is confined by the geometry of the trap (structural or stratigraphic), by capillarity (residual trapping phase), its solubility (as a function of pressure, temperature, and salinity conditions) and mineral precipitation (Benson y Cole 2008, IPCC 2005). The trapping of CO2 due to the geometry of the trap (either due to the presence of a structure or due to lateral facies variations), under static conditions, behaves similar to the trapping of hydrocarbons, with a seal that prevents its escape and retain it permanently, while it is diluted in water or mineralized in the reservoir formation (Bachu, S.; 2001, Zulaika, Hasbollah y Junin 2017, ICTPL 2005). In sedimentary basins, deep traps have great potential to sequester CO2, especially in basins with extensive history of hydrocarbon exploration, as they provide information on hydrogeological systems, petrophysical properties of the reservoirs, extension and seal properties (Bachu, S.; 2001). To optimize its storage space, CO2 must be stored in a critical state in the reservoirs, with temperatures higher than 31ºC and pressures higher than 9 MPa, conditions in which it is reduced to 0.27% of the original volume (NETL; USDOE 2015). These critical CO2 storage conditions generally occur in most sedimentary basins at depths greater than 800 m (Bachu, S.; 2001, Bachu, S.; 2003) and salinities greater than 10,000 ppm (Bachu, S.; 2008, Benson y Cole 2008).
In the central part of the Middle Magdalena Valley basin of Colombia (MMV), sources with emissions greater than 1 MTonCO2/year and potential mature O&G fields have been identified to carry out enhanced hydrocarbon recovery (EOR) with capacities greater than 30 MTonCO2 (Yañez, et al. 2020). However, only a portion of the CO2 used in EOR activities is stored, as much of it leaves during O&G production and must be recycled, vented into the atmosphere, or stored permanently (OECD/IEA 2015). The presence of large sources of CO2 such as refineries, H2 production in plants from heavy crude oil, cement production, among others, suggest the need to look for traps, with adequate storage, containment, and injection capacity to receive volumes greater than 100 MMscf/d, for periods equal to or greater than 20 years. Geologically, the central sector of the MMV basin is part of a polyhistoric basin, whose development has been related to tectonic events that affected northern South America, from the end of the Triassic to the Neogene (Barrero, et al. 2007). These events have left their mark on the basin fill history, characterized by layers with high vertical and lateral variations, accumulated in a wide range of depositional environments, from the outer marine shelf to the continental foothills, as well as numerous unconformities, of variable extent, that make it difficult to identify traps to store large amounts of CO2. Given the need to search for traps to store CO2, as well as the complex stratigraphy that the basin presents, the geological information available from the MMV central sector was integrated, to build a semi-regional static model, useful for identifying corridors with favorable conditions for its storage and planning of subsequent studies (pre-feasibility and feasibility). Such studies enable us to focus efforts and resources on areas with less uncertainty in storage, containment, and injection capacity, thus reducing the identification times of areas with lower risk to carry out CCS projects. This work shows the most relevant aspects of the static model obtained, its application in the identification of corridors with greater favorability for CO2 storage and with lower geological risk of leakage to the surface in the central part of the MMV basin of Colombia.
2. GEOLOGICAL FRAMEWORK
2.1 Morphology of the central part of the Middle Magdalena Valley basin (MMV)
The central part of the Middle Magdalena Valley Basin (MMV) occupies an approximate area of 5,600 km2 and limits to the south and east with the western foothills of the Eastern Cordillera, to the north with the Simití – Cascajal swamp system, and to the west with the eastern foothills of the Serranía de San Lucas (Fig. 1). Morphologically, it is characterized by a relatively flat topography, composed by river flood plains, terraces and elevated plateaus that do not exceed 500 meters above sea level (m.a.s.l.), drained by the Magdalena River and numerous rivers and streams that come from the Eastern Cordillera and the Serranía de San Lucas.
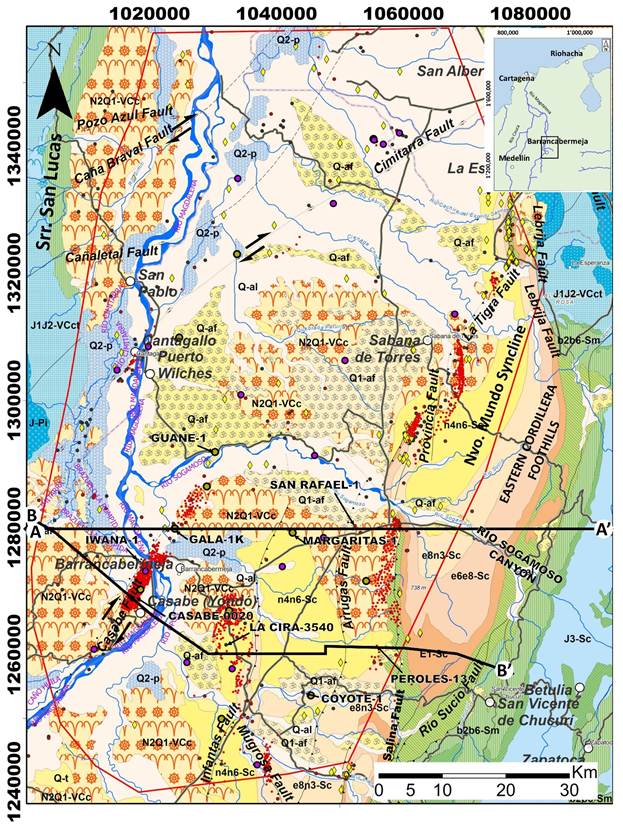
Figure 1. Regional geological map of the central part of the MMV basin (see stratigraphic nomenclature of the map in Fig. 2), taken from the Geological Map of Colombia scale 1:500,000 (Gómez, et al. 2015). The black dots show the location of the wells used to calibrate the seismic interpretation, blue dots the wells used to constrain the Cenozoic Forward Stratigraphic Modeling (FSM), green dots the wells used to constrain the Mesozoic FSM, red dots the wells used to construct the apparent geothermal gradient map, values taken from (Alfaro, et al. 2009), the yellow diamonds show the location of hydrocarbon oil seeps described in publications (Aguilera, et al. 2010, Asadzadeh, Plata y de Souza 2022) and unpublished works based on remote sensing analysis. The red line polygon defines the coverage of the Forward Stratigraphic Modeling and the basin modeling area, while the thick black lines show the location of the chronostratigraphic correlation diagram of Fig. 2 (A – A’) and the structural cross section of Fig. 3 (B – B’).
2.2 Regional Tectonostratigraphy
The northwestern corner of South America has experienced different geological events, which have controlled the formation of tectonic domains, one of which, the central one, includes the Central and Eastern Cordilleras whose eastern and western foothills, respectively, limit the MMV basin (Barrero, et al. 2007). In the central part of the MMV basin, there are numerous O&G fields, as well as geological chartography and stratigraphy works, which have provided data on the age, properties and extension of reservoirs and seals, in addition to understanding the evolution of this area. The basement of the central part of the MMV Basin is composed by igneous-metamorphic rocks from the Santander Massif to the east and the Serranía de San Lucas to the west, with ages between 1.0 and 0.36 Giga years (Ga), considered as part of the Putumayo crustal domain (Restrepo-Pace and Cediel 2010, Ibañez-Mejia 2020), affected by tectono-thermal events during the Permian, Triassic and Jurassic (Rodríguez-Garcia, et al. 2019, Piraquive, et al. 2021, Clavijo, et al. 2008). Above the igneous-metamorphic sequences of the Meso-Neoproterozoic, as well as sedimentary sequences of the Paleozoic, in sectors affected by low-grade regional metamorphism, sediments accumulated during the Triassic-Jurassic rest discordantly. This regional unconformity is interpreted as a result of the collision that occurred during the Permo - Triassic between North and South America, a period during which the supercontinent of Pangea was formed (Restrepo-Pace and Cediel 2010, Rodríguez-Garcia, et al. 2019), exposing great part of the sedimentary sequences accumulated in northern South America to erosion and locally to regional metamorphism. Once the collision is over, the supercontinent of Pangea divides, a process in which basins associated with crustal thinning processes develop in northern South America, concentrating especially in the central part of the current Eastern Cordillera and the MMV (Rolon 2004, Barrero, et al. 2007, Cooper, et al. 1995, Sarmiento, L.F.; 2002, Vasquez, M. F.; 2007).
This process of crustal thinning and strong structural subsidence controlled the distribution of sediments, as well as volcanic flows derived from supra-subduction magmatism during the Middle Jurassic in northern South America (Clavijo, et al. 2008, Cáceres, Cediel and Etayo-Serna 2003, INGEOMINAS 2009, Zuluaga, Pinilla and Mann 2015). Evidence of these processes are the varicolored conglomerates, arenites and mudstones, corresponding to the Girón Group, accumulated in continental depositional environments, unconformably overlain by conglomerates, arenites and gray mudstones of Lower Cretaceous age (Fig. 2), which make up formations such as Los Santos, Cumbre, Rosablanca, Paja and Tablazo, with thicknesses greater than 3 km (Sarmiento, L.F.; 2002), accumulated in restricted marine depositional environments (Moreno 2019, Osorio-Afanador and Velandia 2021). During the Upper Cretaceous, structural subsidence decreases and the distribution of sediments is controlled mainly by global eustatic sea level changes, completely covering the sedimentary basins formed during the Jurassic, mainly by carbonates, dark shales and siliceous mudstones, corresponding to the Simití, Galembo Pujamana, Salada, La Renta and Umir formations (Fig. 2), accumulated in marine depositional environments, connected to the ocean (Etayo-Serna 2019, Guerrero, et al. 2021). During the Paleocene, the central part of the MMV basin was covered by varicolored arenites and mudstones, corresponding to the Fm. Lisama (Fig. 2), accumulated in continental depositional environments, partially connected to the sea, reflecting the onset of the emergence of the Northern Andes (Bayona 2018).
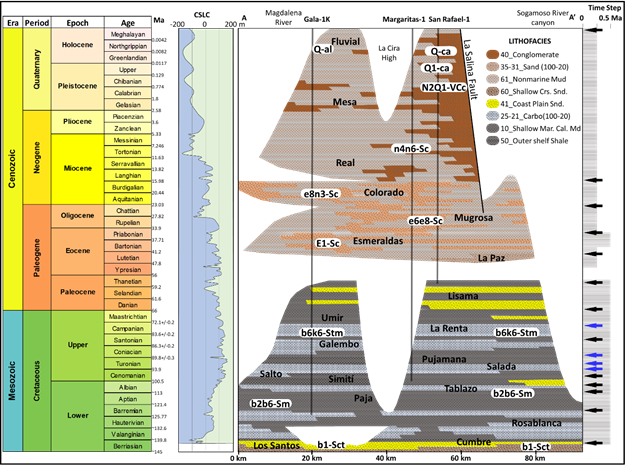
Figure 2. Wheeler diagram for the central part of the MMV basin (see location in Figure 1), extracted from the stratigraphic modeling carried out during this work. On the left, the geological timetable and colors follow the Commission for the Geological Map of the World standard (Cohen, et al. 2013), followed on the right by the composite eustatic change curve (Haq, Hardenbol and Vail 1988), used during Forward Stratigraphic Modeling. The acronyms with a white box refer to the stratigraphic nomenclature of the units shown on the geological map (Figure 1). The color of the units shown in this diagram relates to the lithofacies discretized for the construction of the basin modeling (upper right part of the diagram, see detail in Fig. 7). The right column corresponds to the modeled time step intervals; the black arrows indicate the chronostratigraphic position of the structural maps from the seismic interpretation and the blue arrows indicate the limits derived from the stratigraphic modeling.
Strong tectonic activity is evidenced in sequences of conglomeratic arenites and varicolored arenites and mudstones, corresponding to the La Paz and Esmeraldas formations (target reservoirs for O&G in the area), which rest discordantly on Mesozoic and Paleocene sequences (Fig. 2), accumulated in fluvial depositional environments, during the Eocene (Caballero, Parra, et al. 2013, Caballero, Rodríguez, et al. 2019). During the Oligocene - Miocene, the central part of the MMV basin received sediments from the incipient uplift of the Central and Eastern cordilleras, mainly varicolored arenites and mudstones (Fig. 2), corresponding to the Mugrosa and Colorado formations (O&G reservoirs in the basin), accumulated in continental depositional environments with lacustrine influence (Cabello, et al. 2018). The widespread uplift of the Eastern Cordillera from Miocene to Holocene, along faults such as La Salina, (Horton, Parra and Mora 2019), increased sedimentation rates in the area, with increasing size sediments (Fig. 2), accumulated in high energy depositional environments, corresponding to the Real Gr. and Mesa Fm. (Mora, et al. 2013).
2.3 Structural Geology
Regional geological mapping and seismic information show predominance of compressional structures along the central part of the MMV basin, with a general trend S – N to SSW – NNE (Figs. 1 y 3). One of the faults with the greatest extension and displacement is the La Salina Fault, which delimits a large part of the western edge of the Eastern Cordillera (Fig. 3). This regional structure has been interpreted as the result of a tectonic inversion process, beginning in the Early Cretaceous as a normal fault, controlling the distribution and thickness of sediments along the western edge of the Eastern Cordillera, and subsequently reactivating during the Eocene - Miocene as a reverse fault by regional compression (Sarmiento, L.F.; 2002, Cooper, et al. 1995). In the hanging block of the La Salina Fault, the Nuevo Mundo Syncline is found (Fig. 3), whose folding begins at the end of the Oligocene (Caballero, V.; Parra, M.; Mora, A. 2010). During the time of regional compression, sedimentation along the central part of the MMV basin was affected by other reverse faults such as Arrugas and Infantas (Cabello, et al. 2018), with slight reactivation during the Neogene (Caballero, V.; Parra, M.; Mora, A. 2010, Reyes, Kley and et.al 2012). Others faults with a SW – NE trend such as Casabe, Cimitarra, Caña Braval and Pozo Azul (Figs. 1 and 3), affect the Meso – Cenozoic sedimentary sequence of the basin, control the distribution of hydrocarbons in fields such as Gala, Galan, Cardales, Llanito and Casabe, and guide in some sectors the current course of the Magdalena River (Gómez, et al. 2015, Vargas, M. L.; 2021, París, et al. 2000). Additionally, the analysis of regional earthquake activity suggests that these faults tend to accumulate strain at depths less than 10 km, especially towards the eastern flank of the Central Cordillera, decreasing as they deepen towards the east (Londono 2019, López 2004).
3. STATE OF THE TECHNIQUE
Large-scale Carbon Capture and Storage (CCS) projects began in 1996 with the Sleipner project, followed four years later by the Weyburn project, together reaching around 55 MtonCO2 stored in geological formations by 2022 (Ma, et al. 2022). The requirement of reducing CO2 emissions into the atmosphere has led to over 300 projects proposed globally to carry out CO2 storage, of which only 28 have come into commercial operation by 2020 (Rode, et al. 2023). CCS is a process that consists of separating CO2 from industrial and energy sources, transporting it to a site and isolating it from the atmosphere for a long period of time, in deep reservoirs (NETL;USDOE; 2007, IPCC 2005). In several sectors, extraction and transport of CO2 from process streams has been conducted for decades, and the technology is well-established and mature (Barlow, Shahi y and Kearns 2025). In the search for sites to store safely CO2, in stratigraphic or structural traps, from a static perspective, the techniques and methodologies used to reduce uncertainty are very similar to those used for O&G exploration (Bachu, S.; 2001), where a good knowledge of the regional storage capacity and the way it can evolve over time is critical (Bui, et al. 2018).
Recently, some prefeasibility studies for CO2 storage in subsurface reservoirs have incorporated simulation tools into their activities. These tools (wireline logs with neural networks, Stratigraphic Forward Modelling), allow representing the heterogeneity and anisotropy of properties such as lithology, permeability, pressures, among others, which are basic to simulate the migration of fluids such as CO2, in sedimentary basins and on any time scale (Sheldon, et al. 2023, La Croix, et al. 2018). These simulation tools and techniques can be particularly useful in sedimentary basins with stratigraphically complex reservoirs, such as those in the central part of the MMV basin. The results allow for a reduction of the time required to identify intervals and corridors with greater CO2 storage, containment and injection capacity, as well as identify elements with greater risk and uncertainty, and to support a plan of information acquisition activities that help to reduce them.
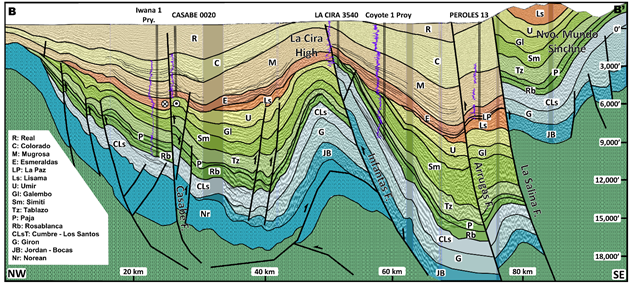
Figure 3. Regional geoseismic profile converted in depth, across the central part of the MMV basin (see location in Fig. 1), illustrating the geometry of the regional faults and folds, the tops of the formations (see formation names in the legend on the left) and the behavior of the Gamma ray in some nearby wells.
4. EXPERIMENTAL DEVELOPMENT
Estimating the CO2 storage capacity in sedimentary basins requires the construction of a static model of the subsurface that reproduces the properties of current reservoirs in three dimensions, such as Porosity, Permeability, Formation Pressure and Temperature. Taken into account the regional scale of this study, the development of deterministic model by geostatistical methods (imaging training, multiple points, etc) is not useful in the study area, due to the high variability in sedimentary environments recorded through Meso – Cenozoic time, variable coverage of information and data quality. The Forward Stratigraphic Modeling tools such as Dionisos (Beicip Openflow), GPM (Schlumberger), SedSimple (WSOFTC) among others, provide the opportunity to use algorithms capable of deterministically reproducing sediments distribution, constrained by well log and seismic interpretation data, and useful in large areas with sediments accumulated in variable sedimentary environments. The Dionisos tool was used herein to develop the FSM, considering the wide spectrum of sedimentary process that can be reproduced (turbidites, carbonate built up, siliciclastic, etc). A list of the information and procedures used to build the static subsurface model for the central part of the MMV basin is described below.
4.1 Available information
The study area is in the central part of the Middle Magdalena Valley (MMV) basin, covering an area of approximately 6,000 km2, where the Barrancabermeja Refinery and numerous O&G producing fields such as Yariguí – Cantagallo, La Cira – Infantas, Casabe, Llanito and Gala – Galán are located. For study purposes, about 650 km2 of 3D seismic and 12,800 km of 2D seismic were interpreted, controlling the interpretation with 119 wells, from which information on porosities, permeabilities, pressure tests, vitrinite reflectance and salinities was extracted (Fig. 1). Thirty wells were also selected to construct VSh and lithofacies logs from the GR log, used for calibrating the results of the Forward Stratigraphic Modeling. Information from oil seeps was also integrated (Aguilera, et al. 2010), as well as spectra - radiometric anomalies indicative of gas or oil (Fig. 1), useful to evaluate possible areas of fluid migration to the surface (Asadzadeh, Plata y de Souza 2022).
4.2 Data integration to build Gross Depositional and Paleobathymetric Maps
In the central part of the MMV basin, 13 regional horizons were interpreted in time domain along 2D and 3D seismic surveys. These regional horizons correspond to the tops of the Pre-Rosablanca (Jurassic?), Rosablanca, Paja, Tablazo, Simití, Galembo, Umir, Lisama, La Paz Esmeraldas, Mugrosa, Colorado and Real formations, accumulated from the Early Cretaceous to the Quaternary, covering a time interval of approximately 140 M.y. The interpretation of these horizons was controlled by incorporating tops interpreted in 119 wells (most of them are exploratory), of which only 12 were used to control the tops of the formations accumulated during the Cretaceous. Fault plane mapping was performed by integrating information from existing interpretations in areas covered with 3D seismic surveys, interpolating the regional fault planes in other sectors with 2D seismic surveys. The interpreted horizons were interpolated by the Kriging method, generating structural surfaces, with a cell size of 250 m, controlling their interpolation to avoid crossings in areas of discordance through operations between them (Fig. 4). To convert the seismic interpretations to the depth domain, a velocity model controlled by the structural surfaces was built, from the base of the Cretaceous to the Quaternary, recovering interval velocity values from check shot logs of 20 wells.
For each structural surface, a Gross Depositional Environment Map (GDEM) was constructed, using published regional maps, through which the macroenvironments were defined, at scales between 1:1'000,000 and 1:2'500,000 (Caballero, Rodríguez, et al. 2019, Caballero, Parra, et al. 2013, Horton, et al. 2015, Cáceres, Cediel and Etayo-Serna 2003, Sarmiento, L.F.; 2002, Villamil 1998, Rolon 2004, Osorio-Afanador and Velandia 2021). In some formations, it was possible to integrate maps of depositional areas at scales between 1:500,000 and 1:50,000, providing details of environments and sub environments (Beltran 2012, Cabello, et al. 2018, Madero, et al. 2010, Avila 2010). Paleoenvironmental interpretations derived from descriptions of stratigraphic columns were also integrated (Etayo-Serna 2019, Etayo-Serna, F. 2019, Nie, et al. 2012) and wells (Morales, L. G.; The Colombian Petroleum Industry 1958, INGRAIN 2012, Pastor-Chacón, et al. 2023, Suarez 2016).
The resulting GDEMs (Fig. 4), reflect the depositional environments for each formation and are useful to guide the construction of Paleo Deep Water Maps (PDWMs). The construction of PDWMs starts with the compilation and placement on each GDEM of paleobathymetric interpretations derived from published facies analysis (Cabello, et al. 2018; Etayo-Serna 2019; Villamil 1998; Sarmiento, L.F.; 2002). Paleobathymetric interpretations were compared with analogues from modern sedimentary environments, to obtain a range of elevation or depth at which sedimentation probably occurred in each paleoenvironment. These values were incorporated into each GDEMs to draw level or bathymetric curves, which were interpolated to create paleobathymetric grids.
4.3 Forward Stratigraphic Modeling (FSM)
The constructed GDEMs and PDWMs are a qualitative approximation of the physical mechanism that controlled the sediment distribution in the central part of the MMV basin (Fig. 4). However, thanks to the use of equations that simulate physical processes sediment transport processes, it is possible to validate their spatial and temporal distribution and properties, under the technique called “Forward Stratigraphic Modeling” (FSM). This type of modeling is based on the iterative use of the sediment transport equation (Sheldon, et al. 2023, Granjeon y Joseph 1999) based on paleotopography, sediment supply rates, sea level variations and subsidence, among others, which is described below:
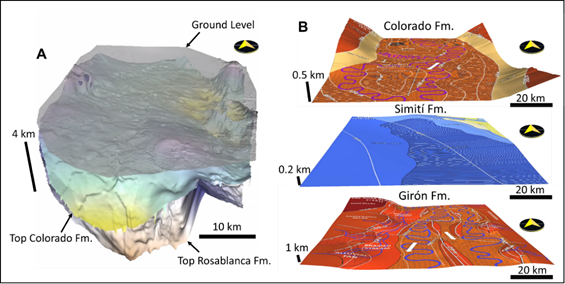
Figure 4. Examples of information integration to build GDEMs and PDWMs, key inputs for the Forward Stratigraphic Modeling: A) Block diagram of selected structural surfaces resulting from regional seismic interpretation; B) Gross Depositional Environmental Maps and Paleo Deep Water grids at selected tops of Meso – Cenozoic formations (Jurassic Girón Fm, Cretaceous Simití Fm and Miocene Colorado Fm), constructed from the integration of isopach maps obtained from the seismic interpretation, paleoenvironmental interpretations from well and stratigraphic columns descriptions, published regional paleogeographic maps and analogues from modern sedimentary environments.
![]()
Where
QSi = Sediment flow for class i sediment (km2/year)
KSi - KWi = Slope boundaries of the progressive transport and diffusion coefficients for class i sediments (km2/year)
h = Height (m)
Qw = Water flow (km2/year)
S = Terrain slope
m y n = Empirical constants
The iterations are carried out in the DionisosFlow® software, a tool developed by the IFPen, which allows simulating the deposition of sediments in the basin, considering the diffusion of multiple classes of sediments, varying the magnitude of the transport process. At each iteration, subsidence/uplift rates, sea level, location of sediment input, amount of sediment, carbonate precipitation and compaction can be modified. The results of the iterations were calibrated with the thickness maps (resulting from the structural maps introduced to the model) and VSh log of the wells, until correlations close to 90% were achieved (Fig. 5). As a result, a 4D model of distribution of fractions of sediment classes (wackestone, calcareous mudstone, arenite, mudstone, and shale) was obtained for the central sector of the MMV basin, which reflects: the architecture of sedimentary sequences (including their boundaries); the depositional areas and the properties of sediments, from late Jurassic to the Quaternary.
The constructed model consists of 93 cells in width and by 120 cells in length, with a cell size of 1 km. It extends 15 km beyond the area of interest, to minimize edge effects, at variable time intervals between 0.5 and 0.25 Ma (348 intervals), increasing in periods with development of reservoirs and regional seals (Fig. 2). Considering the lithologies described in wells and stratigraphic columns, five sedimentary classes were defined, three detrital (sandstone, mudstone and shale) and two calcareous (calcareous mud, wackestone), the latter predominating in the modeling of formations with pre-Eocene age (Fig. 2). During the Mesozoic, the carbonate production rate was restricted to depths less than 100 m for calcareous muds and 50 m for wackestone-type carbonates, and siliciclastic sediment supply coming from eastern side, consistent with regional paleoenvironmental interpretations carried out in outcrops to the east and west of the study area (Etayo-Serna 2019, INGEOMINAS; UIS 2006). During the Cenozoic, the distribution of detrital sedimentary classes (sandstones, mudstones, and mudstones) was modeled, with sedimentary sources coming from directions that reflect the progressive uplifts of the Eastern and Central cordilleras (Cabello, et al. 2018, Bayona 2018, Caballero, Rodríguez, et al. 2019, Horton, et al. 2015), as well as the formation of the Magdalena River hydrographic basin during the Pliocene (López-Ramos, Rincón-Martínez, et al. 2021, Caballero, Parra, et al. 2013, Montes, et al. 2021).
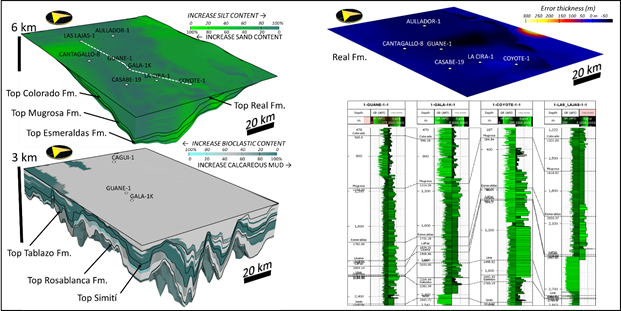
Figure 5. Results of FSM and its calibration. Top left, 3D model of sediment distribution for the mainly siliciclastic sedimentary sequences during the Cenozoic and below, carbonates during the Mesozoic. The upper right corner shows an example of thickness calibration due to differences between maps derived from seismic interpretation vs stratigraphic modeling for the Real Gr., while below an example of the results of the calibration between lithologies derived from Gamma Ray well logs (left column) vs VSh resulting from modeling (right column) is presented.
The sea level variation was simulated using a composite curve, formed by long-term eustatic changes, where cycles greater than 10 My and less than 2 Ma are discretized (Haq, Hardenbol and Vail 1988). To simulate diffusion in water of each of the five sedimentary classes, parameters in the wave action, the energy of the depositional environment and the grain size were iteratively modified. The current limitation of stratigraphic modeling using sediment transport equations is the impossibility to reproduce the evolution of faults, especially reverse faults; therefore, subsidence processes are associated with vertical movements in the basin, estimated from variations in sea level and thicknesses derived from structural maps.
4.4 Basin model
To reproduce the physical, thermal, and chemical processes that occurred during the burial of the central part of the MMV basin, the TemisFlow TM platform, a tool developed by Beicip-Franlab, was used. Temperature estimates from the central part of the MMV basin were derived from an apparent geothermal gradient map. The map was constructed using apparent geothermal gradient values from 2,164 wells that drilled Cenozoic formations (Alfaro, et al. 2009) and 13 that drilled Mesozoic formations, using the following equation (Alfaro, C.; Alvarado, I.; Manrique, A.; 2015, Cardoso and Hamza 2014):
![]()
Where:
GGT = Geothermal Gradient (ºC/km)
TBHC = Corrected Temperature measured at the Bottom Hole (ºC)
TP = Temperature measured at ground level (ºC)
ZBH = Vertical Depth at the Bottom Hole temperature measurement (m)
The apparent geothermal gradient values obtained in each well were interpolated to construct a geothermal gradient cube for the central part of the MMV basin (Fig. 6). The resulting apparent geothermal gradient map was finally calibrated with available vitrinite reflectance values and regional geothermal gradient studies (González, et al. 2020, Alfaro, et al. 2009).
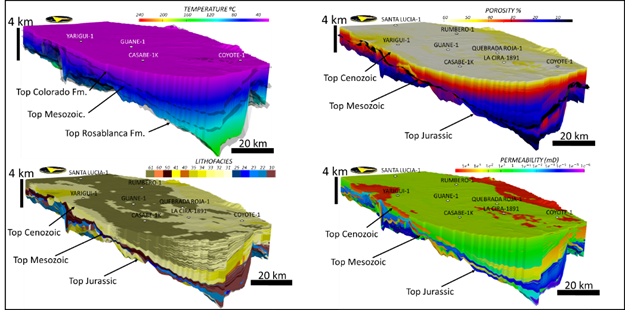
Figure 6. 3D models of properties incorporated into the basin model on the right such as apparent Geothermal Gradient (Top) and lithofacies discretized from FSM (Bottom). A detail on equivalence between the sedimentary classes of the FSM and discretized lithofacies (range of numbers between 10 and 61 observed in the legend), can be seen in Figure 7. On the right, 3D models of properties generated from basin modeling such as Porosity (Top) and Permeability (Bottom).
The geometry of the fault planes as well as the structural surfaces used to perform the FSM were incorporated into TemisFlow TM to build the basin model structure. The fitted basin model structure was populated with the geothermal gradient cube, the FSM results (348 layers), with cells of 1 km side. The resulting basin model have approximately 3.2 million cells, each with properties such as porosity and sedimentary class (Fig. 7). The basin model area was restricted to the flat topography west of the La Salina Fault, avoiding areas affected by thrust faults. The properties of the sedimentary classes generated by the FSM are a continuous variable, and it is necessary to discretize them to populate the properties of the basin model cells. The discretization was performed based on the proportion of each class and its paleodepth, obtaining 7 lithofacies for the carbonate classes and 9 for the detrital classes (Fig. 7). The resulting model allows extracting current parameters of each cell, such as lithology density, porosity, pressures (lithostatic, formation, hydrostatic, capillary), temperature and diagenesis.
The calculation of porosity in each cell (Fig. 6) was based on an empirical relationship with specific stress (Rutqvist, et al. 2002), which is expressed by the following equation:
![]()
Where:
Ø(σ) = Porosity at calculated effective stress conditions (%)
Ø1 = Minimum porosity at conditions of maximum compressibility (%)
Øa = Porosity at first effective stress coefficient conditions (%)
Øb = Porosity at second effective stress coefficient conditions (%)
σ = Effective stress (Mpa)
σa = First effective stress coefficient (MPa)
σb = Second effective stress coefficient (MPa)
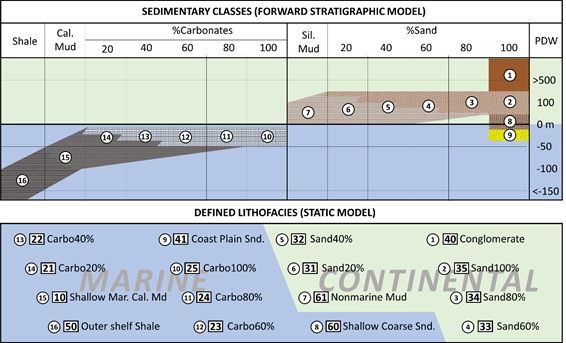
Figure 7. Explanatory legend of sedimentary classes (continuous properties) defined during the FSM (Above), considering the percentage of carbonates and sands vs the paleodepth water (PDW) in which the sediments accumulated and their equivalence in discretized lithofacies (Below), which was defined to populate the basin model. Numbers in a white circle indicate the sedimentary classes defined in the FSM, while the numbers in a white box indicate the corresponding discretized lithofacies in the basin model (these numbers refer to the lithofacies model shown in the 3D model of Fig. 6).
The total porosity values of each lithofacies, once affected by compaction, were used to estimate theoretical permeability values (Fig. 6), using the Kozeny - Carman law (Kozeny 1927, Carman 1939), which is generally expressed under the following equation:
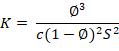
Where
K = Permeability (mD)
Ø = Porosity (%)
c = Kozeny constant (5 when Ø > 0.10K and 0.05 when Ø < 0.10K)
S = Specific surface area of a porous material (m2/m3)
Once the cells of the basin model were populated with the results of total porosity (affected by burial) and permeability, they were calibrated with pressures registered in 30 wells that drilled the Cenozoic sequence and six 1D models used in the Mesozoic sequence.
4.5 Theoretical and Effective storage capacity estimations
From the basin model, properties such as porosity, pressure (lithostatic, hydrostatic, formation and capillary), irreducible water saturation and temperatures were extracted from each cell, from which the CO2 storage capacity was estimated. To obtain the density of CO2, graphs of its variation as a function of temperature and pressure were used (Bachu, S.; 2003), to construct a linear regression useful at temperatures above 80°C and pressures above 18 MPa.:
![]()
Where
ρCO2 = CO2 density at reservoir P and T conditions (kg/m3)
P = Reservoir pressure (MPa)
T = Reservoir temperature (ºC)
The density of water (Fig. 8) was calculated as a function of pressure and temperature using the following equation, which was taken from TemisFlow TM water composition libraries:
![]()
Where
ρw = Water density at P and T conditions of the reservoir (kg/m3)
ρref = Reference water density (kg/m3)
P = Reservoir pressure (MPa)
T = Reservoir temperature (ºC)
Knowing the density of CO2 in each model cell, parameters were extracted from the rock volume to initially calculate the Theoretical Storage Capacity – TSCCO2 (Fig. 8), using the following expression:
![]()
![]()
Where
TSCCO2 = Theoretical Storage Capacity of CO2 (kg/m3)
CO2-Free = CO2 in free stage (kg/m3) modified from (Bachu, S.; 2008)
CO2-Diss. = CO2 dissolved in water (kg/m3)
V = Rock volume (m3)
NTG = Net to Gross (%)
Ø = Porosity (%)
Swirr = Irreducible water ratio (%)
A = Cell area (m2)
SolCO2-sw = Solubility of CO2 in salt water (kg/m3)
ρCO2 = CO2 density at P and T reservoir conditions (kg/m3)
ρw = Water density at P and T reservoir conditions (kg/m3)
This estimated TSCCO2 value indicates the maximum storage potential within each cell of the model, disregarding the cap rock capillary pressure. It can be considered the storage potential with an ideal seal.
The maximum CO2 column that can be retained by the cells (Fig. 8), related to the pressure exerted by the fluids in each cell, was deduced from the densities of water and CO2 against the capillary pressure difference between cells vertically, by using the following expression modified from (Busch and Müller 2011):
![]()
Where
Eff.C.H.CO2 = Effective column height of retained CO2 (m)
PcTOP = Capillary pressure at the top of each cell (MPa)
PcC = Capillary pressure in the center of the cell (MPa)
ρw = Water density at P and T reservoir conditions (kg/m3)
ρCO2 = CO2 density at P and T reservoir conditions (kg/m3)
With the effective height of the CO2 column that can be retained by the seal, the Effective Storage Capacity (ESCCO2) that can be retained by each cell was estimated, to define cells corridors with best conditions to contain more CO2 than others, using the following expression:
![]()
In this work we have calculated the ESCCO2, incorporating the effective height of the CO2 column that can be retained (Eff.C.H.CO2), since it includes variables such as CO2 density, capillary pressures of the seal and the reservoir. Furthermore, capillary pressures depend on CO2 saturation and rock porosity, which in turn depend on the pressure regime. Estimating ESCCO2 using Eff.C.H.CO2 allows all conditions simulated by the basin model in each cell to be considered and avoids the use of an efficiency factor that can be subjective.
4.6 Common Risk Segment Analysis
Analysis using Common Risk Segment Maps (CRSM) has been a very useful tool in O&G exploration and applicable to the regional evaluation of any geological resource. Considering that CO2 capture, and sequestration (CCS) constitutes a geological resource that can be evaluated as commodities in terms of resources and reserves (Bachu, S.; 2008, Pale Blue Dot 2019), the use of CRSM analysis and uncertainty are conceptually valid for the screening of the best sites for storage. Thus, under the concept of CRSM analysis, it is possible to define corridors with better conditions for CCS activities, defining plays, mapping their distribution, identifying their variations, estimating their geological Chance of Succes (CoS) and creating a composite map by their combination (Bump, Hovorka y Meckel 2021). Some key factors in subsurface CO2 storage are storage capacity, injection (directly related with the permeability) and containment due to seal integrity (Bump, Hovorka and Meckel, 2021), which can be derived from static models such as the one built for the MMV basin area.
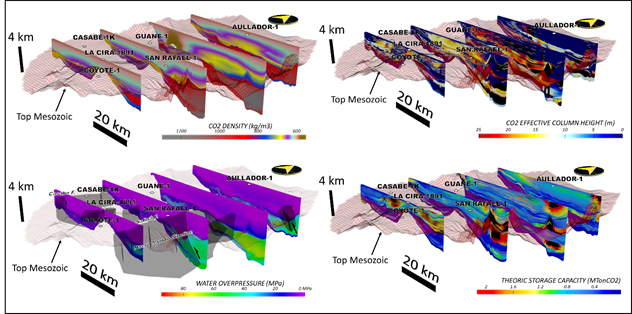
Figure 8. 3D views of properties extracted from regional basin modeling. On the left-hand side, CO2 density (Top) and formation water over pressure (Bottom), while on the right-hand side, maximum effective CO2 column that can be retained by the seals (Top) and Theoretical CO2 Storage Capacity – TSCCO2 (Bottom)
Considering the number of layers contained in the MMV basin model (348), it is possible to perform the three-dimensional Common Risk Segments Analysis (3DCRSA), resulting in the production of cubes of properties, capacities, and CoS. Some properties were discretized, by assigning a value of 0 when it does not meet the conditions and 1 when it does, to allow the CO2 storage in each cell of the model (See details in Fig. 9). The conditions of does not meet or meet applied to each property are described below:
· Depth: 0 for depths less than 1 km (storage is inefficient) and greater than 4 km (cost of operations increase), 1 for depths between them (optimum conditions for storage)
· Water pressure: 0 for pressure values greater than 100 MPas (high hydrostatic pressures), 1 for pressure values less than 100 MPas
· CO2 phase: 0 for subcritical phase (< 9 Mpas and < 30°C), 1 for critical phase (> 9 Mpas and > 30°C)
· Total CO2 column: 0 for column values less than 50 m, 1 for column values greater than 50 m
· Effective CO2 column: 0 for column values less than 50 m, 1 for column values greater than 50 m
· Permeability: 0 for values less than 0,001 mD (values close to seal lithologies), 1 for values greater than 0,001 mD (minimum value for injecting CO2 without reservoir stimulation)
· Distance to fault planes: 0 for distance less than 2 km to the fault plane (less to this value, the risk of leaking is very high), 1 for distance grater than 2 km to the fault plane (more than this value, the risk of leaking through fault plane decrease)
Finally, two 3DCRSA were performed, one to identify corridors with the highest Total Column of CO2 (TSCCO2) and the other to identify corridors with the best Effective Column of CO2 that can be retained by the seal (ESCCO2), by estimating a sample mean, converted to a percentage (Fig. 9), as described below:

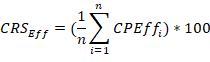
Where
CRSTotal = Percentage value of the Categorized Properties considering the TSCCO2 in each cell
CRSEff = Percentage value of the Categorized Properties considering the ESCCO2 considering the effective column that can be retained by the seal in each cell
n = Number of Categorized Properties
CPt = Properties Categorized into values 0 or 1 according to their risk, considering the TSCCO2
CPEff = Properties Categorized into values 0 or 1 according to their risk, considering the effective column that can be retained by the seal
The results of the 3DCRSA are expressed in percentage terms, with values between 0 and 100, which can be discretized into intervals that reflect the extension of sectors with high (<33), moderate (33 – 66) and low risk (>66) to carry out CO2 storage.
5. RESULTS
5.1 Tectonostratigraphic evolution of the central area of the MMV basin
Subsidence, sedimentary budget (represented in fluvial discharge, sedimentary contribution, and carbonate growth) and changes in sea level are the dominant geological processes in the distribution of sediments in basins and continental margins, which can be quantified through the FSM. The curve obtained from the change in the mean depth of the basal FSM surface (base of the Rosablanca Fm.) with respect to time (140 Ma), shows five inflection points (110, 100, 58, 42 and 34 Ma), which define six intervals of subsidence rate along the central part of the MMV. Average values of Paleo Deep Water (PDW), fluvial discharge rates, sediment supply and carbonate growth have synchronous variations with the six intervals of subsidence rate (Fig. 10). During the first interval (145 to 110 Ma), the average subsidence rate reached 28.6 m/My and the average paleobathymetry varied from 100 meters above sea level (m.a.s.l.), to 5 m below sea level (m.b.s.l.), while the fluvial discharge increased from 210 to 270 m3/sec, the sediment supply increased from 330 to 420 km3/My and carbonate growth from 20 to 50 m/My. In these conditions, the FSM results show an increase in the proportion of siliciclastic muds and shales (45% to 55% and 25% to 35% respectively), decrease in siliciclastic sands proportion (30% to 10%) and eventual maximums (25%) occur in the proportion of bioclastic carbonates (Fig. 10). Through the second interval (110 to 100 Ma), the average subsidence rate increases to 100 m/My, the average paleobathymetry varied from 5 to 10 m.b.s.l., the fluvial discharge decreases from 240 to 120 m3/sec, the sediment supply from 420 to 210 km3/My and carbonate growth from 50 to 0 m/My. Considering the results of the FSM, the proportion of siliciclastic muds and shales decreased (55% to 25% and 35% to 20% respectively), siliciclastic sands proportion increased (10% to 15%) and eventual maxima (35%) occurred in the proportion of bioclastic carbonates (Fig. 10).
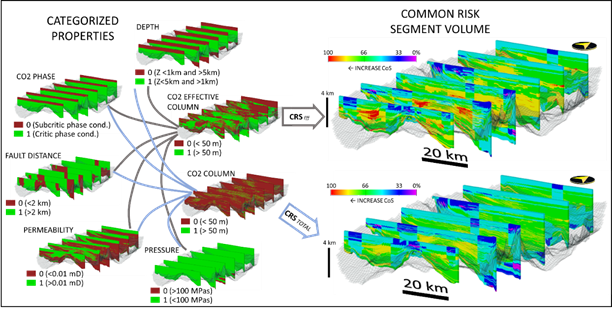
Figure 9. Explanatory diagram for identifying sectors with the greatest opportunity to store CO2 through 3DCRSA. On the left hand the properties used, and the categorization criteria are detailed (0 high risk, 1 low risk), while on the right, results obtained by combining the categorized properties, considering the maximum CO2 column retained by the seal (Top, CRSEff) and the TSCCO2 (Bottom, CRSTOTAL) are presented.
The third interval (100 to 58 Ma) is characterized by average subsidence rates near to 41.7 km/My, paleobathymetry between 10 m.b.s.l. to 100 m.a.s.l., fluvial discharge decreases from 120 to 0 m3/sec and sediment supply from 210 to 0 km3/My. Analysing the FSM results, the proportion of siliciclastic muds and shales increased (25% to 45% and 20% to 45% respectively), as did the proportion of siliciclastic sands from 15% to 20% (Fig. 10). During the fourth interval (58 to 42 Ma), the average subsidence rate decreases to 218.75 m/My, and the average paleobathymetry varied from 100 to 170 m.a.s.l., while the fluvial discharge decreased from 0 to 1250 m3/sec and sediment supply from 0 to 450 km3/My. As a reflection of these conditions, a regional unconformity was developed between Cretaceous – Cenozoic rocks in high structural zones and late Cretaceous – Cenozoic rocks in structurally depressed zones (Fig. 2 and 3). In these conditions, the FSM shows a decrease in the proportion of siliciclastic muds (45% to 5%), increase the proportion of shales (45% to 65%), and increase in siliciclastic sands proportion (20% to 55%). Through the fifth interval (42 to 34 Ma), the average subsidence rate reached 37 m/My, paleobathymetry varied from 170 to 100 meters above sea level (m.a.s.l.), fluvial discharge increased from 100 to 900 m3/sec and sediment supply from 450 to 650 km3/My. In these conditions, the FSM shows a constant proportion of siliciclastic shales and sandstones (65% 45% respectively) and decrease in siliciclastic muds proportion (5% to 0%). The last interval (34 to 0 Ma), the average subsidence rate reaches 117 m/My, paleobathymetry varies from 0 to 200 m.a.s.l., fluvial discharge remains constant near to 900 m3/sec and sediment supply near to 650 km3/My. According to the FSM results the shales proportion increased (45 to 75%), muds proportion increased (0 to 5%) and sand proportion decreased (45 to 25%).
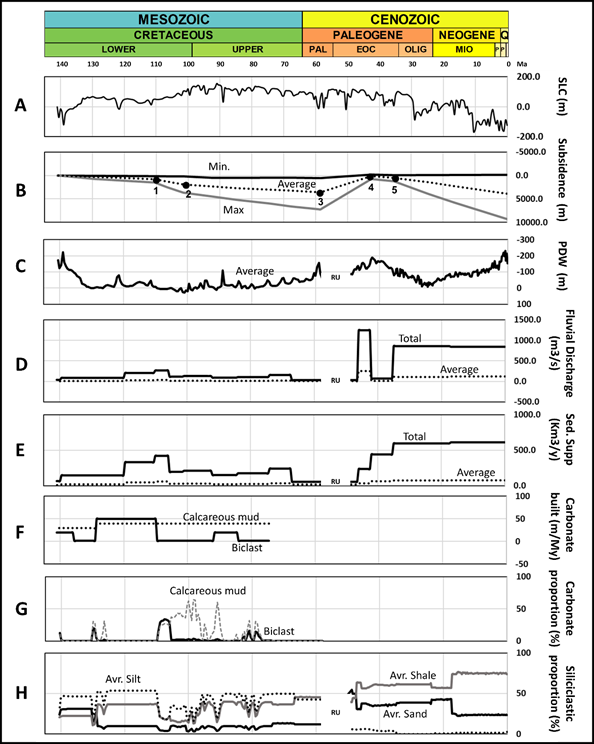
Figure 10. Curves of variation in magnitudes of the geological processes that controlled the distribution of sediments during the last 145 My in the central part of the MMV basin and average proportions of resulting sedimentary classes (Sand, mud, shale, bioclastic carbonates, calcareous mud), values obtained from forward stratigraphic modeling (FSM). From top to bottom: A) Composite eustatic change curve (Haq, Hardenbol and Vail 1988); B) Subsidence or maximum exhumation (thick gray line), average (dashed black line), minimum (thick black line) and major inflections (black dots numbered 1 to 5); C) Average values of paleobathymetry - paleoelevation (positive and negative respectively on the right vertical axis); D) Total river discharge (solid black line) and average (dashed black line); E) Total fluvial sediment supply (solid black line) and average (dashed black line); F) Average growth rates of bioclastic carbonates (solid black line) and calcareous muds (dashed black line); G) Average proportion of bioclastic carbonates (solid black line) and calcareous muds (dashed); H) Average proportion of siliciclastic sediments (sands in black line, shale in gray line and muds in dotted black line). The acronym RU refers to the regional unconformity present in the basin from the end of the Paleocene to the beginning of the Eocene.
5.2 Geothermal structure
Interpolation of apparent geothermal gradient data shows that the basin varies between 13 and 49ºC/km, with an average close to 25ºC/km, presenting local anomalies with values higher than 35ºC/km along regional faults such as Cimitarra, Casabe and Infantas, where isotherms tend to present a gap between isotherms and the structural contours (Fig. 11). This gap increases in the older and deeper sedimentary sequences, gradually decreasing towards the youngest and shallower sequences (Fig. 11). The depth map of the 75°C isotherm suggest the existence of a horst and grabens in echelon arrange, with clockwise rotation direction towards the northeast, limited by regional faults with northeast trend, of dextral type, such as Cimitarra, Casabe and Caña Braval (Fig. 11). Along the hanging block of reverse faults such as La Tigra, Arrugas and La Salina, the 75°C isotherm tends to be shallower (Fig. 11). These arrangements and trends are also present in the temperature maps interpolated at the tops of sedimentary sequences, especially the Mesozoic ones (Fig. 11). Regional geological sections, integrating the variation in temperature with depth, show that in the areas of apparent geothermal gradient anomalies (A, C and Cs), the isotherms tend to converge, in areas where the base of the Mesozoic exceeds 3.5 km, while in areas of Neogene sediments with thicknesses greater than 2 km, the isotherms tend to separate from each other (Fig. 12). Towards the western edge of the basin (eastern flank of the Serranía de San Lucas), the isotherms tend to rise, following the regional trend of rise of the metamorphic igneous basement (Fig. 12).
5.3 Storage Capacity of CO2
Basin modeling shows that the Meso-Cenozoic formations analyzed in the central part of the MMV basin can reach a Theoretical Storage Capacity of CO2 (TSCCO2) close to 830 GTon CO2. It also shows that the Effective Storage Capacity of CO2 (ESCCO2), considering the effective column that can be retained by each layer, reaches 293 GTon CO2. The average values of the different input and output properties of the basin model in each of the 348 layers that compose it, show trends that allow them to be separated into 4 intervals (Fig. 13), namely: Interval A, composed by the Rosablanca, Paja and Tablazo formations; Interval B, constituted by the Simití, El Salto, Salada, Pujamana, Galembo, La Renta, Umir, Lisama formations; Interval C, composed by La Paz, Esmeraldas, Mugrosa, Colorado formations; Interval D formed by the Real and Mesa formations. Considering porosity values greater than 10%, permeabilities greater than 0.1 mD and storage capacities greater than 10 MTonCO2 (theoretical and effective by retention), it is possible to identify 7 levels (1, 2, 3, 4, 5a, 5b y 6) with better potential to store CO2 (Fig. 13).
Interval A:
Basin modeling for the formations in zone A suggests that the TSCCO2 does not exceed 200 MTon per layer, except for the Tablazo Fm., where it can reach 5,000 MTon (Fig. 13). A volumetric relationship, obtained by dividing the TSCCO2 by the volume of rock, allows us to observe that the layers of interval A tend to have values greater than 20 MTon/km3 in beach sand - carbonate lithofacies (Rosablanca and Tablazo formations), while in lithofacies dominated by muds and calcareous shales, the values tend to be less than 5 MTon/km3 (Fig. 13). The ESCCO2, considering the effective column that can be retained by each layer of interval A, tends to be less than 20 MTon, except for layers with beach sand – carbonate lithofacies. (Rosablanca and Tablazo formations, corresponding to levels 1 and 2 with the highest storage capacity), where it reaches 200 MTon/CO2 and even exceeds 3,000 MTon/CO2 in some intervals (Fig. 13).
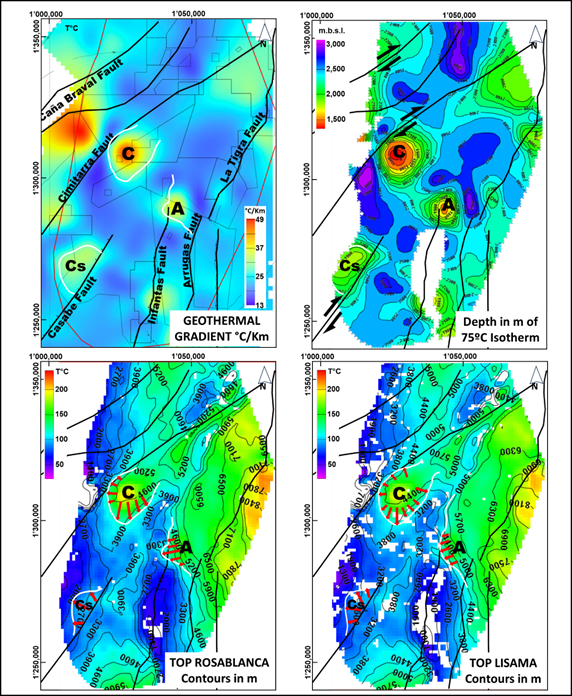
Figure 11. Apparent geothermal gradient maps for the central part of the MMV basin (Top left), depth of the 75ºC isotherm (Top right), projected temperatures at the top of the Rosablanca (Bottom left) and Lisama (Bottom right) formations. In the apparent geothermal gradient map, three anomalies (identified with letters A, C and Cs) are observed, adjacent to regional faults. These anomalies coincide with areas where the temperature extrapolated to the top of Cretaceous and Paleocene formations is not consistent with the structural contours (zones A and C delimited with white lines and arrows with red filling that indicate the direction of the gap between structural contour and temperatures at the top of the formations). Note the arrangement of depressed and elevated areas in a staggered manner at the depth of the 75ºC isotherm, between regional strike-slip faults, as well as the apparent geothermal gradient anomalies (A, C and Cs).
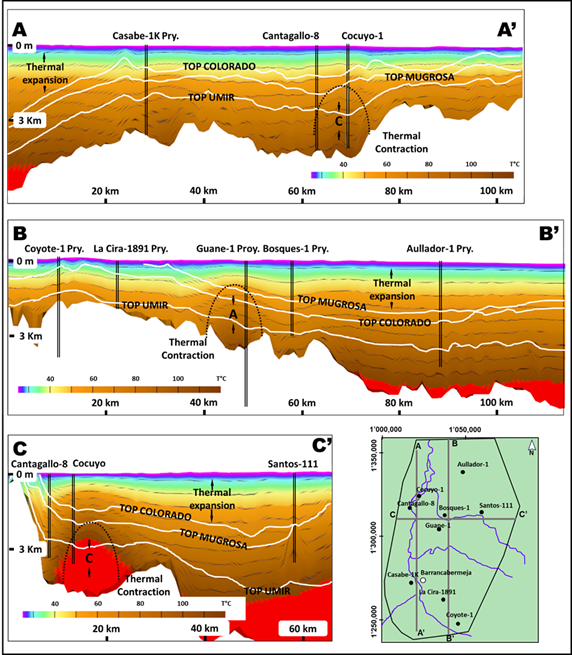
Figure 12. Schematic geological sections showing the depth of Meso and Cenozoic formations (white lines) and isotherms (black lines). Note the location of anomalies A and C identified on the geothermal gradient map (See location in Fig. 11), consistent with regions where isotherms tend to converge vertically. On the other hand, it is observed that in areas where the thicknesses of the Real and Mesa formations approach 2 km thick, the isotherms tend to separate.
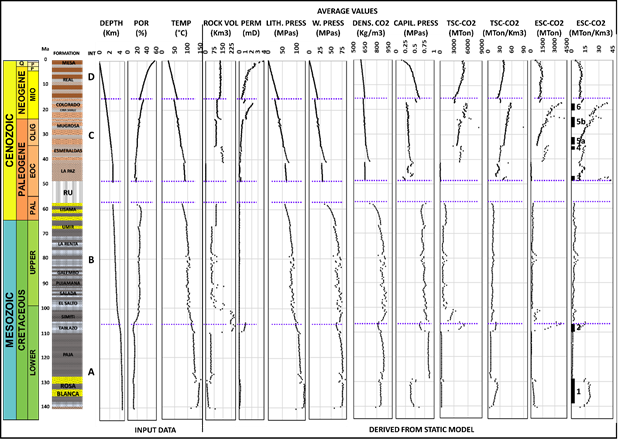
Figure 13. Average curves of values of depth, porosity, temperature, rock volume, permeability, lithostatic pressure, water pressure under reservoir conditions, CO2 density values, capillary pressure, Theoretical Storage Capacity of CO2 (TSCCO2) total and per volumetric unit (km3 of rock), Effective Storage Capacity of CO2 (ESCCO2) total and per volumetric unit (km3 of rock), extracted from the results obtained from basin modeling of properties in the central part of the MMV basin. The column titled INT refers to the 4 intervals of properties with distinctive trends in their values, while the thick black lines in the right column, numbered from 1 to 6, show the levels with the highest ESCCO2 per km3 (except for the level 5a, selected intended for presenting distant corridors from the fields to the base of the Mugrosa Fm. with good ESCCO2) levels that were selected for the construction of maps with greater storage potential (Figs. 15, 16, 17 and 18).
The volumetric relationship, obtained by dividing the ESCCO2 by the rock volume, shows that the layers of zone A tend to present values lower than 2 MTonCO2/km3, except for two-layer levels (levels 1 and 2) composed predominantly by beach sand – carbonate lithofacies, in which it can reach average values between 15 and 20 MTon/km3 (Fig. 13). The average distance between fault planes that affect interval A is close to 8 km (Fig. 14), tending to be much smaller in the vicinity of regional faults such as Casabe, Cimitarra and Infantas, where more complex structural frameworks are developed. The map layer for the level 1 with the highest ESCCO2 suggests 3 restricted corridors, with capacities greater than 0.5 MTon per cell, two located between the Gala-1K, Llanito-1, Quebrada Roja-1 and Infantas-1613 wells (corridors 1 and 2) and one to the north (corridor 3), near the Caguí-1 well (Fig. 15). The layer map of the level 2 with higher ESCCO2 shows a broader distribution of areas with capacities greater than 0.5 MTon per cell, along a corridor with a general N-S trend (corridor 1), which covers the western half of the work area, between the San Rafael-1, Sogamoso-1, Cristalina-1, Yariguí-1 and Peñas Blancas-4 wells (Fig. 15). A second and more restricted corridor (corridor 2) is located between the Cagüi-1 and Aullador-1 wells (Fig. 15).
Interval B:
The formations that constitute this interval are characterized by porosities close to 20%, but permeabilities close to 0mD, with storage capacities less than 10 MTonCO2/km3 and can be considered a regional seal. Some calcareous-sandy intervals in the Simití Fm. have potential to store CO2 amounts near to 8 MtonCO2/km3 (Fig. 13).

Figure 14. Average curves of closeness to planes in each layer of the model (curve on the left), percentage of the area that has each range of Chance of Successful (CoS), for the Theoretical Storage Capacity scenario (second curve of left to right called CoS-TSC) and for the Effective Storage Capacity scenario (third curve from left to right called CoS-ESC). Note the difference between the areas in each CoS range (curve on the right), whose positive values suggest that the CoS-TSC analysis tends to present greater extension in areas of the same CoS range than the CoS-ESC analysis, while negative values suggest the opposite. The column titled INT refers to the 4 intervals of properties with distinctive trends in their values, while the black lines, numbered from 1 to 6, show the levels with the highest ESC-CO2 per km3, selected for the construction of maps with the greatest potential. storage (Figs. 15, 16 and 17).
Interval C:
This interval is composed of the La Paz, Esmeraldas, Mugrosa and Colorado formations, accumulated from the middle Eocene to middle Oligocene, currently reaching average depths that vary between 2.8 and 1 km, total porosities that increase from 18% to 35% and temperatures that decrease from 90 to 50°C (Fig. 13). The rock volume ranges between 80 and 150 km3, with a minimum represented in the La Paz Fm. with less than 10 km3. Permeability values are on average close to 0.1 mD, increasing towards the top to values close to 2 mD. The values of lithostatic pressure and water pressure under reservoir conditions in the Paleogene and early Neogene formations tend to decrease towards the top, from 60 to 25 MPa and 28 to 15 MPa respectively. In this range, the density of CO2 can reach average values of 650 Kg/m3 and average capillary pressures of 0.40 to 0.27 MPa (Fig. 13). The TSCCO2 obtained from basin modeling for the formations of interval C reaches values close to 6,000 MTon per layer in the Colorado Fm., 4,500 MTon in the Mugrosa Fm. and less than 50 Mton in the La Paz Fm. (Fig. 13). A volumetric relationship, obtained by dividing the TSCCO2 by the rock volume, shows that the layers of the C interval tend to have values greater than 25 MTon/km3 and even reach 60 MTon/km3 towards the top (Fig. 13). The ESCCO2, considering the effective column that each layer can retain in interval C, tends to increase from 100 to 4,500 MTon/km3 (Fig. 13).
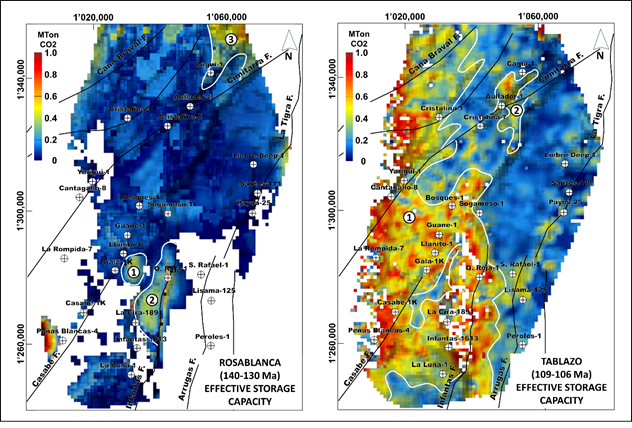
Figure 15. Maps of Effective CO2 Storage Capacity (ESCCO2) in formations of interval A (levels 1 at left and 2 at rigth referred to in Figs. 14 and 15). Delimited in a thick white line, the corridors with capacities greater than 0.5 MTonCO2 per cell in layers of levels 1 and 2 are identified (numbers in a white circle refer to the corridors described in the text) considering the effective column retained by the seal.
The volumetric relationship, obtained by dividing the ESCCO2 by the volume of rock, shows that the layers of interval C tend to register values close to 10 MTonCO2/km3, highlighting 5 levels of layers (3, 4, 5a, 5b and 6), which exceed 15 MTonCO2/km3 and towards the top, they can reach 40 MTonCO2/km3 (Fig. 13). The mean distance between fault planes affecting interval C increases gradually from base to top, from 6.6 to 7.9 km (Fig. 14). The layer map of level 3 with the highest ESCCO2, (pre-Esmeraldas Fm.), shows a discontinuous corridor with capacities greater than 0.5 MTon per cell, along the western edge of the study area (corridor 1), located east of the Yarigui-1, Cantagallo-8 and Cristalina-1 wells (Fig. 16). The layer map of level 4 with the highest ESCCO2, (Esmeraldas Fm.), shows two corridors arranged on the edges of the study area, parallel to the flanks of the Eastern and Western cordilleras (corridors 1 and 2), with capacities greater than 1 MTon per cell (Fig. 17). At the base of the Mugrosa Fm. (level 5a), the ESCCO2 map, shows two corridors with effective storage capacities greater than 1 MTon, one western (corridor 1), very close to the direction of the Casabe Fault, and another eastern (corridor 2), between the Infantas and Arrugas faults (Fig. 17).
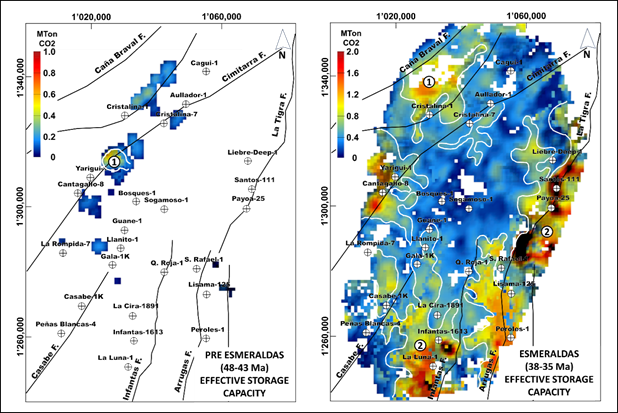
Figure 16. Maps of Effective Storage Capacity of CO2 (ESCCO2) in formations of the C interval (levels 3 at left and 4 at rigth referred to in Figs. 14 and 15). Delimited by a thick white line, corridors with capacities greater than 0.5 MTonCO2 per cell in level 3 layers and greater than 1 MTonCO2 per cell in level 4 layers are identified (numbers in white circles refer to the corridors described in the text) considering the effective column retained by the seal.
At the top of the Mugrosa Fm. (level 5b), the ESCCO2 map shows 3 corridors with storage capacities greater than 1.5 MTon per cell. One of these corridors, the westernmost one (corridor 1), is located between the Casabe and Cimitarra faults, tending to have storage capacities close to 3 MTon towards the north, near the Cristalina-7 well (Fig. 17). A second corridor (corridor 2) is located in the central part of the study area, along the course of the Infantas Fault, reaching storage capacities of 4 MTon per cell, between the La Luna-1 and La Cira-1891 wells (Fig. 17). A third corridor (corridor 3) is located along the western flank of the Eastern Cordillera, limited by the Arrugas and La Tigra faults, reaching values close to 4 MTon between the Peroles-1, Lisama-125 and Santos– 111 wells (Fig. 17). Finally, to the base of the Colorado Fm., several Level 6 layers show storage capacities greater than 1.5 MTon along three major corridors (Fig. 18). One to the west (corridor 1), along the Cimitarra Fault, with storage capacities close to 2 MTon per cell, near to the Cantagallo - 8, Yariguí - 1 and Cristalina - 1 wells. A second corridor defined between the Casabe and Arrugas faults (corridor 2), segmented by the Arrugas Fault, reaching storage capacities close to 2.5 MTon per cell between the La Luna-1, Infantas – 1613 and La Cira-1891 wells. A third corridor is located along the La Tigra Fault, with capacities close to 2.5 MTon south of the Payoa-25 well and north of Liebre Deep-1 (Fig. 18).
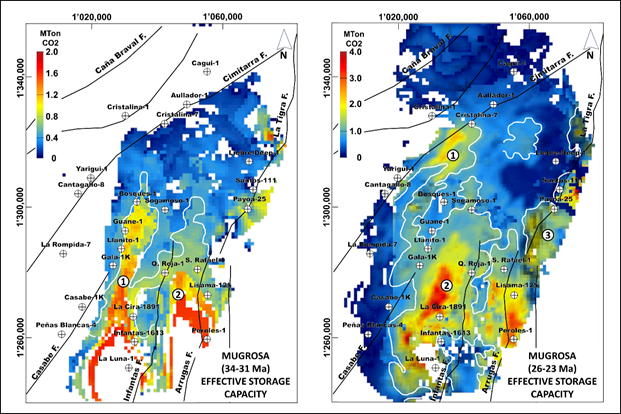
Figure 17. Maps of Effective CO2 Storage Capacity (ESCCO2) in formations of interval C (levels 5a at left and b at rigth referred to in Figs. 14 and 15). Delimited by a thick white line, the corridors with capacities greater than 1 MTonCO2 per cell in layers of levels 5a and 5b are identified (numbers in a white circle refer to the corridors described in the text) considering the effective column retained by the seal.
Interval D:
The Real and Mesa formations comprise this interval, accumulated from the mid-Miocene to the Holocene, currently reaching average depths that vary between 1 and 0 km, total porosities that increase from 22% to 55%, temperatures that decrease from 55 to 25°C (average ambient temperature) and rock volume close to 140 km3 (Fig. 13). Despite the good porosity and permeability values in this interval, the formations that comprise it behave as free or semi-confined aquifers, making CO2 storage impossible (Fig. 13).
5.4 Stratigraphic levels with best geological CoS for CCS
The properties obtained from the 3D regional basin modeling were weighted as a percentage and discretized into favorability ranges, which, evaluated with the 3D Common Risk Segment Analysis method (3DCRSA), allowed identifying stratigraphic intervals and corridors with greater CoS to store CO2. The 3DCRSA was performed on the entire static model, for two scenarios: one assuming the total CO2 column that each cell can store (CRS Total); and other considering the effective column of CO2 that the seal can retain in each cell (CRS Eff). The average CoS values extracted from each layer of the model for the CRS Total scenario present high values (between 84 and 99%), in intervals A (Rosablanca and Tablazo formations) and C (La Paz, Esmeraldas, Mugrosa and Colorado formations), where in some stratigraphic levels (levels 1 to 6, previously defined in the results of basin modeling), they cover between 30 and 60% of study area (Figs. 13 to 18). The average CoS values for the CRS Eff scenario show that in addition to intervals A (stratigraphic levels 1 and 2) and C (stratigraphic levels 3 to 6), some stratigraphic levels between the Galembo and La Renta formations (Figs. 13 and 14), presents high values (between 84 and 99%) in 30 to 40% of their area.
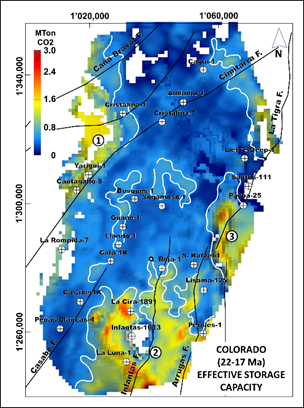
Figure 18. Map of Effective CO2 Storage Capacity (ESCCO2) in formations of interval C (level 6 referred to in Figs. 14 and 15). Delimited in a thick white line, the corridors with capacities greater than 1 MTonCO2 per cell in layers of level 6 are identified (numbers in a white circle refer to the corridors described in the text) considering the effective column retained by the seal.
6. RESULTS ANALYSIS
6.1 Basin history subsidence
The FSM constructed in the central part of the MMV basin suggests that the average subsidence has been variable during the las 140 Ma, enabling the identification of 5 inflection points, which limit 6 periods, of which, five record rates of variable subsidence and one of exhumation (Fig. 10). Through the first period (145 – 110 Ma), average subsidence rates reach 28.6 m/My, values close to those estimated in regional works, thus suggesting, for this part of the MMV basin, processes associated to the extension of the lithosphere of the “passive rifting” type (Sarmiento, L.F.; 2002). The lithofacies obtained from the FSM suggest a mixed siliciclastic - carbonate sedimentation, which tends to be more carbonate - mudstone at the end of this time (Fig. 10). The decrease in siliciclastic and the increase in mudstones at the end of this period may suggest a gradual distancing of the sediment source areas or a general decrease in the height of the reliefs adjacent to the basin. The second period (110 – 100 Ma) is characterized by a strong increase in its average of subsidence rate, average paleodepth close to sea level, increase in the proportion of calcareous mudstones - carbonates and a very low proportion of shales, muds and siliciclastics sediments (Fig. 10). The decrease in the growth rate carbonates and the increase in muds of terrigenous origin suggest the flooding of the central sector of the MMV basin and the discharge of fine sediments from the east (Etayo-Serna 2019). Through the third period (100 - 58 Ma), subsidence rate reached 41.7 km/My and paleodepths that gradually increased from 15 to 50 m.b.s.l. (Fig. 10). During this period, the accumulation of calcareous mudstones predominates, with a gradual increase in siliciclastic contributions, mainly shales and mudstones, coming mainly from the east (Cáceres, Cediel and Etayo-Serna 2003, Bayona 2018).
From the middle Paleocene to the middle Eocene (58 to 42 Ma), exhumation predominates (Fig. 10), with average rates of -218 m/My, which allows us to propose an average uplift for the central part of the MMV basin of 1.7 km (fourth interval). This uplift gives rise to a regional stratigraphic hiatus, which has been reported in numerous papers, associated with large structures that involving basement, due to tectonic inversion, thrust and folding, which affected the Magdalena Valley (Cooper, et al. 1995, Caballero, Parra, et al. 2013, Silva, et al. 2013). Erosion removed a large part of the Mesozoic stratigraphic record in some structures, such as Alto de La Cira and south of Campo Casabe, and partially to the north of the Llanito field structure (Reyes, Kley and et.al 2012, Vargas 2021, Caballero, Rodríguez, et al. 2019). During the fifth interval (42 – 34 Ma), subsidence rates move to 28 m/My, average paleobathymetry of 150 m.a.s.l., conditions in which the area developed in a dispersed manner between regional highs, accumulating predominantly sandy-clayey sediments (Fig. 10). The FSM suggests that the sources of sedimentary contribution during this period (42 to 34 Ma) are close to the area, the most important being those located to the west and east, resulting from the emergence of the western flank of the Eastern Cordillera (Srr. of San Lucas) and eastern flank of the Central Cordillera (Srr. Los Cobardes and Macizo de Santander), distributed by major drainages with a general South – North course, consistent with published regional works (Caballero, Parra, et al. 2013, Cabello, et al. 2018, Clavijo, et al. 2008, Cáceres, Cediel and Etayo-Serna 2003). During the last 34 Ma, subsidence rates varied between 42.7 and 52.1 m/My, decreasing during the last 16 Ma to 49 m/Ma and paleobathymetries between 120 and 170 m.a.s.l. (Fig. 10), period during which the FSM mainly shows the sedimentary contribution of claystones, followed by arenites (Fig. 10). During this period, major river currents distributed sediments throughout the area, varying their orientation according to the uplift of the eastern and western mountain range flanks. Additionally, there was also influence from lake systems slightly connected to the sea, especially at the beginning of the Miocene (Cabello, et al. 2018, Caballero, Rodríguez, et al. 2019, Montes, et al. 2021, López-Ramos, Rincón-Martínez, et al. 2021).
6.2 Thermal structure
The average apparent geothermal gradient estimated through corrected bottomhole temperatures for the central sector of the MMV basin reaches an average of 25ºC/km, close to the values estimated in previous works (Matiz 2018, González, et al. 2020). At the national scale, this average is lower than those of most basins, surpassing only those with predominantly Cenozoic sedimentary fills such as Chocó, Urabá, the lower Magdalena Valley and Guajira (Alfaro, et al. 2009). The structural map at the base of the basin model (Rosablanca Fm.) shows strong similarities with both the apparent geothermal gradient map and the depth map of the 50°C isotherm, suggesting in the central part a structural fabric characterized by stepped blocks, whereas towards the eastern edge, it indicates areas of hanging blocks on reverse faults involving basement (Fig. 11). It has been proposed that this similarity is a consequence of thermal effects associated with heat refraction from the basement (González, et al. 2020), therefore, it can be suggested that the patterns observed in the apparent geothermal gradient map, the 50°C isotherm and temperature interpolations to structural maps of Mesozoic formations, have been the result of a segmentation of the basement (translated into thermal segmentation), by SW - NE strike-slip fault systems and thrust (Fig. 11). Along these regional faults such as Cimitarra, Casabe and Infantas, a gap occurs between isotherms and structural contours in basal sequences such as Rosablanca and Lisama, a gap that gradually decreases in the Cenozoic sequences (Figs. 11 and 12). Thermochronology and geothermal works suggest fault zones that involve basement, present areas with high permeability, where fluids circulate and control the distribution of temperature anomalies (Milesi, et al. 2020, Duwiquet, et al. 2019). The above allows us to postulate that, along the fault planes such as Cimitarra, Casabe and Infantas, the basement presents zones with high permeability, improving the circulation of fluids and concentrating heat locally (Fig. 11). Finally, both the segmentation of the thermal structure and the anomaly areas lose expression in the Cenozoic sequences, especially in areas where the Neogene (Real Fm.) exceeds 2 km in thickness (Fig. 12). Given the possibility that regional strike-slip faults are areas of high permeability, they should be considered as corridors where CO2 storage represents moderate to high risk.
6.3 Potential for CO2 storage in the MMV
The layer-by-layer analysis of the static model allowed us to separate the Meso-Cenozoic sequence studied in the central part of the MMV basin into 4 intervals (Fig. 13), called A, B, C and D, distinguishing 7 levels. (1, 2, 3, 4, 5a, 5b and 6), due to its greater ESCCO2 (Figs. 13 and 14). Levels 1 and 2 are the most basal levels of the model, with average volumetric ratios (ESCCO2 /rock volume) between 15 and 20 MTon/km3 (Fig. 14). These levels are characterized by being the deepest in the area (4 km on average), presenting low permeabilities (<<1 mD) and lithostatic and hydrostatic pressures above 100 and 60 MPa respectively (Fig. 13). The permeability ranges obtained by the model for levels 1 and 2 are very low compared to those observed in operating geological storage sites such as Sleipner, Weyburn or Snøhvit, where injection rates exceed 0.3 MTon CO2 per year (Xie, et al. 2016). On the other hand, high pressures mean a higher injection pressure in the formation, which may be close to its fracture pressure. The foregoing allows us to suggest that, despite the important storage potential in Mesozoic pore spaces in the central part of the MMV basin, the low permeabilities, high pressures and great depths are not optimal for their use to store CO2 at injection rates comparable to industrial projects. Levels 3 to 6 (segment C) have depths less than 2.5 km, permeabilities that tend to increase up to 4 mD on average, with lithostatic and hydrostatic pressures reduced to one third of those estimated for interval A (Fig. 13). These conditions led us to consider that levels 3 to 6 present better conditions for CO2 injection, requiring lower compression pressures and higher injection rates than those of interval A. The ESCCO2 layer maps from levels 3 to 6 (Figs. 16 to 18) show corridors with volume to develop storage projects. However, the maps suggest that the areas of these corridors with higher ESCCO2 are preferentially found in areas of mature fields such as the La Cira – Infantas, Casabe, Llanito – Gala – Galán and Yariguí – Cantagallo trains (Figs. 16 to 18). The above must be considered when selecting sites to store CO2 at these levels, looking for those that are far from areas of mature field and avoiding flooding and leaks through their O&G production or through abandoned wells. To avoid site selection along high sites with high TSCCO2 or ESCCO2 near to leaking zones like old O&G fields, oil seeps or active faults, it is necessary to include CoS analysis, which will be further discussed later.
6.4 Geological CoS along corridors with best ESC-CO2
The average values obtained layer by layer from the analysis by CRS Total and CRS Eff scenarios show that the high geological CoS levels (>67%) coincide with the levels of high TSCCO2 and ESCCO2 values (Fig. 14, levels 1 to 6). Based on the previous analysis, the Cretaceous levels (1 and 2) were rejected to evaluate CCS projects, given their low permeability, high pressures and high costs of drilling wells at such depths (close to 4 km), so they were concentrated on the Cenozoic levels (3, 4, 5a, 5b y 6). The best corridors for CCS in basal Cenozoic reservoirs (level 3) are restricted in the northwest part of the study area, between Cristalina-7 and Cantagallo-8 and with high geological CoS ranges (Fig. 19). However, the most prospective corridors of level 3 are located near to regional faults that eventually act as high permeability zones, as suggested by the presence of anomalies in the thermal structure. This may present a risk of CO2 leakage that needs to be assessed, taking advantage of the permeability linked to regional faults that serve as fluid migration systems from the surface to the subsurface and vice versa.
The Esmeraldas Fm. (level 4) shows two wide corridors (corridors 1 and 2) with high ESCCO2, but with variable values from high to low geological CoS (Fig. 19). The corridor 1 (western corridor) is divided into segments, with its northern segment (north of the Cristalina-1 and Cristalina-7 wells) which is an area with high geological CoS values, while the southern segment (area of the wells Yarigui-1, Cantagallo-8), extends from areas with high to low values of geological CoS (Fig. 19). Corridor 2 (central-eastern corridor) is widely extended, although with numerous branches, some of which occupy low geological CoS sectors, especially in areas such as Infantas-1613 and La Rompida-7 wells, to moderate in SW areas such as Guane-1, Llanito-1, Gala-1K and Casabe-1K wells or between the Liebre Deep-1, Payoa-25, Lisama-126 and Peroles-1 wells in the eastern part (Fig. 19). Despite the wide extension of high ESCCO2 along the corridors of the level 4, regional fault activity during the Neogene and the large number of wells in old O&G fields affect the retention capacity of the seals, reducing the geological CoS of CO2 storage. Thus, the integrated maps of corridors with higher ESCCO2 and geological CoS values suggest that storage should be oriented in areas far from O&G fields with extensive production histories and active faults. Some of the areas recommended for CCS at level 4 are located between the Quebrada Roja- 1 and San Rafael-1 or north of the Cristallina-1 and Cristalina-7 wells (Fig. 19).
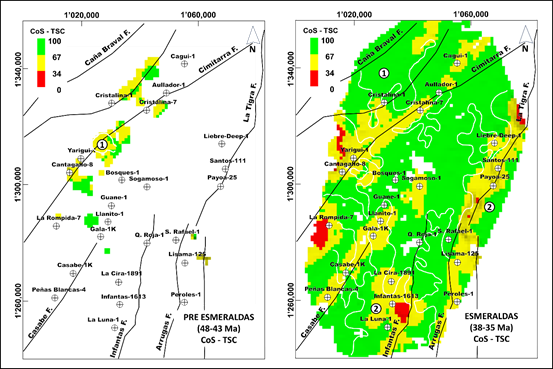
Figure 19. Maps resulting from the superimposition of the distribution of corridors with higher ESCCO2 and CoS – TSC of levels 3 (left map, Pre Esmeraldas-Fm.) and 4 (right map, Esmeraldas Fm.) of C interval. The colors refer to the three CoS ranges (red corresponds to low values, yellow to moderate values and green to high values) while the numbers in a white circle refer to the corridors described for each level (see Fig. 17 to observe the corridor delimitation considering the ESCCO2).
The Mugrosa Fm. has two prospective CCS levels (5a and 5b). Level 5a (lower Mugrosa Fm.) shows that corridors with higher ESCCO2 (corridors 1 and 2) tend to be restricted to the south and east of the study area (Fig. 20). The corridor 1 (southernmost corridor) occupies sectors with low to moderate geological CoS values, especially between the La Luna-1 and La Cira-1891 wells, while between the Guane-1 and Bosques-1 wells, high geological CoS values tend to occur (Fig. 20). The corridor 2 (easternmost corridor) suggest that areas with high geological CoS for CCS are located between the San Rafael-1 and Quebrada Roja-1 wells (Fig. 20). When integrating the polygons of the level 4 with higher ESCCO2 and its corresponding geological CoS, it is noted that the areas of O&G producing fields present low values, due to the presence of numerous D&P wells can compromise the retention capacity. Accordingly, CCS activities should be located away from old O&G producing fields and active faults, such as the areas between the San Rafael-1 and Gala-1K wells or north of the Llanito-1 and Bosques-1 wells (Fig. 20).
Level 5b (upper Mugrosa Fm.) has a greater extension and better storage capacities (double) than those identified in level 5a (Fig. 20). At level 5b, three corridors can be identified (Fig. 20), one to the west, between the Cristallina-7 and Casabe-1K wells (corridor 1), another towards the center, between the Sogamoso-1 and La Luna-1 wells (corridor 2) and one to the east, between the Liebre Deep-1 and Peroles-1 wells (corridor 3). The central corridor presents variable geological CoS ranges, from low towards the south, around La Luna-1 well area to high geological CoS values in the north, in the Sogamoso-1 well area (Fig. 20). The eastern corridor occupies areas with moderate to low geological CoS, while along the western corridor the geological CoS varies from moderate to high (Fig. 20). Cross-analysis of the corridors with the highest ESCCO2 and geological CoS suggests that the best areas for CCS projects are located south of the Cristalina-1 well and between the Quebrada Roja-1 and San Rafael-1 wells (Fig. 20).
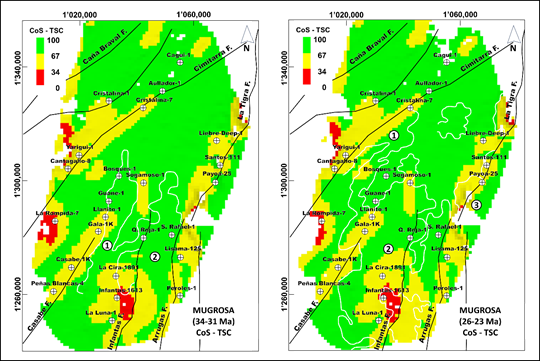
Figure 20. Maps resulting from the superimposition of the distribution of corridors with higher ESCCO2 of levels 5a (left map, base of the Mugrosa Fm.) and 5b (right map, top of the Mugrosa Fm.) of c interval and CoS – TSC. The colors refer to the three CoS ranges (red corresponds to low values, yellow to moderate values and green to high values) while the numbers in a white circle refer to the corridors described for each level (see Fig. 18 to observe the corridors delimitation considering the ESCCO2).
Level 6 is present near the top of Colorado Fm where three wide corridors are defined (Fig. 18), with intermediate ESCCO2 values with respect to levels 5a and 5b. The cross-analysis between the location of the polygons of the three corridors with the highest ESCCO2 and geological CoS allows us to observe that corridors 1 (most western) and 3 (most eastern) cover areas with moderate to low geological CoS (Fig. 21). Corridor 2, located in the central part of the study area, covers to the south, between the La Luna-1 and Llanito-1 wells, areas with moderate to low geological CoS, while between the Guane-1 and Bosques-1 wells, they are high (Fig. 21). Thus, cross-analysis suggests that a prospective area for storing high geological CoS CO2 at level 6 is the northern part of corridor 2 (Fig. 21).
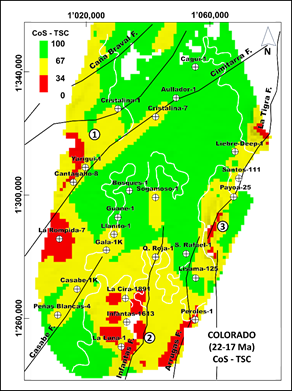
Figura 21. Map resulting from the superimposition of the distribution of corridors with higher ESCCO2 of level 6 (Colorado Fm. base) of C interval and CoS – TSC. The colors refer to the three CoS ranges (red corresponds to low values, yellow to moderate values and green to high values) while the numbers in a white circle refer to the corridors described for each level (see Fig. 19 to observe the corridors delimitation considering the ESCCO2).
7. CONCLUSIONS
This work successfully represents the regional evolution of the central part of the MMV basin in Colombia using FSM, generating a three-dimensional sediment distribution model calibrated with wells and seismic interpretation, which captured the great variability of depositional areas recorded during the last 140 Ma, despite the heterogeneity of the available information. Such results allowed to populate a static model with 16 lithofacies, maintaining the horizontal and vertical variability obtained in the FSM and assigning them properties such as porosity and permeability. The populated model is quite robust in terms of the number of layers and cells used in a basin simulator (3.2 million cells) and is a powerful tool for identifying corridors for CCS activities, allowing for the calculation of properties such as temperature, pressures, and fluid densities, among others, in each cell. By incorporating CRSA into the basin simulation results, the geological CoS three-dimensionally (conventionally performed in 2D) were assessed to define the best areas for storing CO2. Such a workflow allows a quick selection of areas and mature prospects, and exploration plays for any subsurface resource (including CO2 storage), within short timeframes and minimal costs.
Considering the processes of subsidence and sedimentary filling, it becomes apparent that the first three periods of subsidence (145 to 110, 110 to 100 and 100 to 58 Ma), reflect a general process of crustal thinning, which initially formed an intracontinental basin at the beginning of the Cretaceous and evolved into a passive margin that received fine-granular clastic contributions from the east, during the Upper Cretaceous – Lower Paleocene. During the Upper Paleocene, the area was subjected to extensive exhumation, forming a landscape composed of plateaus of variable relief, extensive zones of laterization and regional incision. Once the exhumation was completed, a fourth period of subsidence develop, linked to the tectonic load exerted by the flanks of the Eastern and Western cordilleras in the uplift process. This process increases during the last 34 Ma (fifth period of subsidence), especially due to bending linked to thrust along faults such as La Salina.
Thermally, the central part of the MMV basin is segmented, with local anomalies of greater geothermal gradient, controlled by regional faults, while other sectors present lower geothermal gradients (dilation of the thermal structure). The segmentation of the thermal structure seems to reflect the basement structure involved in regional strike-slip and thrust faults movements, along which the geothermal gradient is greater, due to the active migration of fluids in areas of greater permeability, increasing the heat flow. Therefore, in these areas it is necessary to assess the risk of fluid leakage to the surface, especially in CO2 storage projects. Furthermore, the expansion of the thermal structure seems to be linked to areas with high sedimentary rate during the Neogene.
The results of the basin model suggest 7 levels (1, 2, 3, 4, 5a, 5b and 6), with higher ESCCO2. Levels 1 and 2 are the most basal levels of the model (Mesozoic formations), while levels 3 to 6 are found at a shallower depth (Paleogene formations). Given the low permeability ranges, great depths and high pressures (lithostatic and hydrostatic), the feasibility of carrying out high CO2 injection rates in levels 1 and 2 (Mesozoic formations) is ruled out. On the other hand, the lower depth, the higher permeability and the low pressures enable us to propose that CO2 injection rates may be higher in levels 3 to 6 (Paleogene formations).
Cross-analysis of the corridors with the best ESCCO2 (identified in levels 3 to 6 of the C interval) and high geological CoS, can be considered areas where it is possible to store CO2, which are summarized below: a) Level 3 - Northwest part of the study area, between Cristalina-7 and Cantagallo-8; b) Level 4 - Between the Quebrada Roja- 1 and San Rafael-1 and north of the Cristallina-1 and Cristalina-7 wells; c) Level 5 a: Between the Quebrada Roja- 1 and San Rafael-1 or north of the Llanito-1 and Bosques-1 wells; d) Level 5 b - South of the Cristalina-1 well and between the Gala-1K and San Rafael-1 wells; e) Level 6 - Between Llanito-1 and Bosques-1 well.
ACKNOWLEDGMENTS
This project was conducted within the framework intended for the transformation of refinery activities at Ecopetrol, led by the Vice Presidency of Low Emissions. We thank the Upstream vice presidencies for access to subsurface information and the Beicip – IFP team for their patient work and application of routines to reach 3DCRSA.
BIBLIOGRAPHY
Afanador, D. O., & Velandia, F. (2021). Late Jurassic syn-extensional sedimentary deposition and Cenozoic basin inversion as recorded in The Girón Formation, northern Andes of Colombia. Andean Geology, 48(2), 237-266. https://doi.org/10.5027/andgeoV48n2-3264
Aguilera, R., Sotelo, V., Burgos, C., Arce, C., Gómez, C., Mojica, J., ... & Osorno, J. (2010). Organic geochemistry atlas of Colombia. Second Edition Earth Sciences Research Journal, 14, Special Edition, 164 p. 61-77. https://www.anh.gov.co/documents/14/Atlas_Geoquimico_2010.pdf
Aktouf, A., & Bentellis, A. (2016). CO2-storage assessment and effective capacity in Algeria. SpringerPlus, 5(1), 1038. https://doi.org/10.1186/s40064-016-2682-7
Alfaro, C., Alvarado, I., Quintero, W., Hamza, V., Vargas, C., & Briceño, L. (2009). Mapa preliminar de gradientes geotérmicos de Colombia. In XII Congreso Colombiano de Geología (pp. 1-24). https://www.researchgate.net/publication/317497383_Evaluacion_termal_de_6_pozos_de_la_parte_central_de_la_cordillera_oriental_Colombia_a_partir_de_paleogeotermas_implicaciones_sobre_la_historia_termica_y_los_hidrocarburos
Alfaro, C., Alvarado, I., & Manrique, A. (2015). Heat flow evaluation at Eastern Llanos sedimentary basin, Colombia. In World Geothermal Congress (Vol. 34, pp. 1-9). https://www.semanticscholar.org/paper/Heat-Flow-Evaluation-at-Eastern-Llanos-Sedimentary-Alfaro-Alvarado/a41fcfd55678e8b2b3c8a43ff406bc94616f45bf/figure/0
Asadzadeh, S., Arango, I. R. P., & de Souza Filho, C. R. (2022). Mapping natural oil seeps in the Middle Magdalena Basin (Colombia) using WorldView-3 satellite data. AAPG Bulletin, 106(4), 783-801. https://doi.org/10.1306/09282120069
Avila, N. A. (2010). Aplicación de datos de afloramiento en el modelo de facies de las formaciones Colorado y Mugrosa en el campo Casabe sur en la cuenca del Valle Medio del Magdalena. [Tesis de pregrado, Universidad Industrial de Santander].. https://noesis.uis.edu.co/items/30f4b482-284f-4e55-89f3-3a9275c0b6c5
Bachu, S. (2008). Comparison between methodologies recommended for estimation of CO2 storage capacity in geological media. In Carbon sequestration leadership forum, Phase III Report. https://citeseerx.ist.psu.edu/document?repid=rep1&type=pdf&doi=a745711090b05956f9c122c462fc6391b31e91b7
Bachu, S. (2001). Geological sequestration of anthropogenic carbon dioxide: applicability and current issues. In L. C. Gerhard, W. E. Harrison, & B. M. Hanson (Eds.), Geological perspectives of global climate change. American Association of Petroleum Geologists. https://doi.org/10.1306/St47737C16
Bachu, S. (2003). Screening and ranking of sedimentary basins for sequestration of CO2 in geological media in response to climate change. Environmental Geology, 44(3), 277-289. https://doi.org/10.1007/s00254-003-0762-9
Barlow, H., Shahi, S., & Kearns, D. (2025). Advancements in CCS technologies and costs. https://www.globalccsinstitute.com/wp-content/uploads/2025/01/Advancements-in-CCS-Technologies-and-Costs-Report-2025.pdf
Barrero, D., Pardo, A., Vargas, C. A., & Martínez, J. F. (2007). Colombian sedimentary basins: Nomenclature, boundaries and petroleum geology, a new proposal. In J. Letouzey (Ed.), Petroleum and tectonics in mobile belts (pp. 81–100). Agencia Nacional de Hidrocarburos. https://www.researchgate.net/publication/326424170_Colombian_Sedimentary_Basins
Bayona, G. (2018). El inicio de la emergencia en los Andes del norte: una perspectiva a partir del registro tectónico-sedimentológico del Coniaciano al Paleoceno. Revista de la Academia Colombiana de Ciencias Exactas, Físicas y Naturales, 42(165), 364-378. https://doi.org/10.18257/raccefyn.632
Beltran, E. C. (2012). Estudio sedimentológico comparativo entre las formaciones Mugrosa y Colorado; y modelamiento de los niveles de las arenas A2 de la Formación Colorado en el campo Casabe en la cuenca del Valle Medio del Magdalena, Colombia [Tesis de pregrado, Universidad Industrial de Santander]. https://noesis.uis.edu.co/items/c857f670-4328-40ef-8612-bcaaebd8f982
Benson, S. M., & Cole, D. R. (2008). CO2 sequestration in deep sedimentary formations. Elements, 4(5), 325-331. https://doi.org/10.2113/gselements.4.5.325
Bui, M., Adjiman, C. S., Bardow, A., Anthony, E. J., Boston, A., Brown, S., Fennell, P. S., Fuss, S., Galindo, A., Hackett, L. A., Hallett, J. P., Herzog, H. J., Jackson, G., Kemper, J., Krevor, S., Maitland, G. C., Matuszewski, M., Metcalfe, I. S., Petit, C., ... Mac Dowell, N. (2018). Carbon capture and storage (CCS): the way forward. Energy & Environmental Science, 11(5), 1062-1176. https://doi.org/10.1039/C7EE02342A
Bump, A. P., Hovorka, S. D., & Meckel, T. A. (2021). Common risk segment mapping: Streamlining exploration for carbon storage sites, with application to coastal Texas and Louisiana. International Journal of Greenhouse Gas Control, 111, 103457. https://doi.org/10.1016/j.ijggc.2021.103457
Busch, A., & Müller, N. (2011). Determining CO2/brine relative permeability and capillary threshold pressures for reservoir rocks and caprocks: Recommendations for development of standard laboratory protocols. Energy Procedia, 4, 6053-6060. https://doi.org/10.1016/j.egypro.2011.02.610
Caballero, V. M., Rodríguez, G., Naranjo, J. F., Mora, A., & De La Parra, F. (2020). From facies analysis, stratigraphic surfaces, and depositional sequences to stratigraphic traps in the Eocene–Oligocene record of the southern Llanos Basin and northern Magdalena Basin. The geology of Colombia, 3, 283-330. https://www.researchgate.net/profile/Victor-Caballero-3/publication/342328390_From_Facies_Analysis_Stratigraphic_Surfaces_and_Depositional_Sequences_to_Stratigraphic_Traps_in_the_Eocene_-_Oligocene_Record_of_the_Southern_Llanos_Basin_and_Northern_Magdalena_Basin/links/5eed6a05458515814a6ecda3/From-Facies-Analysis-Stratigraphic-Surfaces-and-Depositional-Sequences-to-Stratigraphic-Traps-in-the-Eocene-Oligocene-Record-of-the-Southern-Llanos-Basin-and-Northern-Magdalena-Basin.pdf
Caballero, V., Parra, M., Mora, A., López, C., Rojas, L. E., & Quintero, I. (2013). Factors controlling selective abandonment and reactivation in thick-skin orogens: A case study in the Magdalena Valley, Colombia. https://doi.org/10.1144/SP377.4
Caballero, V., Parra, M., & Mora Bohorquez, A. R. (2010). Levantamiento de la Cordillera Oriental de Colombia durante el Eoceno tardío-Oligoceno temprano: proveniencia sedimentaria en el Sinclinal de Nuevo Mundo, cuenca Valle Medio del Magdalena. Boletín de geología, 32(1), 45-77. http://www.scielo.org.co/scielo.php?pid=S0120-02832010000100003&script=sci_arttext
Cabello, P., Lopez, C., Gamba, N., Dussán, M. I., Torres, E., Ballesteros-Torres, C. I., ... & Ramos, E. (2018). An integrated approach to define new plays in mature oil basins: The example from the Middle Magdalena Valley basin (Colombia). AAPG Bulletin, 102(11), 2201-2238. https://doi.org/10.1306/03291816528
Cáceres, C., F. Cediel, and F. Etayo-Serna. (2003). Guía introductoria de la distribución de facies sedimentarias de Colombia, Mapas de distribución de facies sedimentarias y armazón tectónico de Colombia a través del Proterozoico y del Fanerozoico. INGEOMINAS. https://catalogo.sgc.gov.co/cgi-bin/koha/opac-detail.pl?biblionumber=46163
Cardoso, R. A., & Hamza, V. M. (2014). Heat flow in the Campos sedimentary basin and thermal history of the continental margin of southeast Brazil. International Scholarly Research Notices, 2014(1), 384752. https://doi.org/10.1155/2014/384752
Carman, P. C. (1939). Permeability of saturated sands, soils and clays. The Journal of Agricultural Science, 29(2), 262-273.. https://doi.org/10.1017/S0021859600051789
Clavijo, J., Mantilla, L., Pinto, J., Bernal, L., & Pérez, A. (2008). Evolución geológica de la Serranía de San Lucas, norte del Valle Medio del Magdalena y noroeste de la Cordillera Oriental. Boletín de Geología, 30(1), 45-62. http://www.scielo.org.co/scielo.php?pid=S0120-02832008000100004&script=sci_arttext
Cohen, K. M., Finney, S. C., Gibbard, P. L., & Fan, J. X. (2013). The ICS international chronostratigraphic chart. Episodes, 36(3), 199-204. . https://doi.org/10.18814/epiiugs/2013/v36i3/002
Cooperation, A. P. E. (2005). CO2 storage prospectivity of selected sedimentary basins in the region of China and South East Asia. APEC Energy Work Group EWG Project. https://www.apec.org/Publications/2005/06/CO2-Storage-Prospectivity-of-Selected-Sedimentary-Basins-in-the-Region-of-China-and-South-East-Asia
Cooper, M. A., Addison, F. T., Alvarez, R., Hayward, A. B., Howe, S., Pulham, A. J., & Taborda, A. (1995). Basin development and tectonic history of the Llanos Basin, Colombia. https://doi.org/10.1306/M62593C35
CSA Group. (2008). Assessment of the Potential for Geological Storage of CO2 for the Island of Ireland. Sustainable Energy Ireland. https://www.seai.ie/sites/default/files/publications/Assessment-of-the-Potential-for-Geological-Storage-of-CO2-for-the-Island-of-Ireland.pdf
Duwiquet, H., Arbaret, L., Guillou-Frottier, L., Heap, M. J., & Bellanger, M. (2019). On the geothermal potential of crustal fault zones: a case study from the Pontgibaud area (French Massif Central, France). Geothermal Energy, 7, 1-29. https://doi.org/10.1186/s40517-019-0150-7
Ellett, K., Zhang, Q., Medina, C., Rupp, J., Wang, G., & Carr, T. (2013). Uncertainty in regional-scale evaluation of CO2 geologic storage resources—Comparison of the Illinois Basin (USA) and the Ordos Basin (China). Energy Procedia, 37, 5151-5159. https://doi.org/10.1016/j.egypro.2013.06.430
Etayo-Serna, F. (2019). Basin development and tectonic history of the Middle Magdalena Valley. Estudios geológicos y paleontológicos sobre el Cretácico en la región del embalse del río Sogamoso, Valle Medio del Magdalena, 413-423.
Etayo-Serna, F., Arenas, D. M., Sánchez, G. M., Melo, R. T., & Ospitia, G. G. (2020). Estudios geológicos y paleontológicos sobre el Cretácico en la región del embalse del río Sogamoso, Valle Medio del Magdalena. https://libros.sgc.gov.co/index.php/editorial/catalog/book/24
Energy, P. B. D. (2020). Global Storage Resource Assessment–2019 Update. https://www.globalccsinstitute.com/resources/publications-reports-research/global-storage-resource-assessment-2019-update/
Geological Survey (US), & Paris, G. (2000). Map and database of Quaternary faults and folds in Colombia and its offshore regions (pp. 1-61). US Geological Survey. https://doi.org/10.3133/ofr00284
Gómez, J., Montes, N. E., Nivia, A., & Diederix, H. (2015). Atlas geológico de Colombia 2015. Escala, 1(500), 000. https://www.researchgate.net/publication/309533584_Plancha_5-06_del_Atlas_Geologico_de_Colombia_2015
González, R. E., Suárez, C. O., Higuera, I. C., & Rojas, L. E. (2020). Alternative workflow for three-dimensional basin modeling in areas of structural complexity: Case study from the Middle Magdalena Valley, Colombia. AAPG Bulletin, 104(1), 1-19. https://doi.org/10.1306/0415191612917185
Granjeon, D., & Joseph, P. (1999). Concepts and applications of a 3-D multiple lithology, diffusive model in stratigraphic modeling. https://doi.org/10.2110/pec.99.62.0197
Guerrero, J., Montes, L., Jaillard, E., & Kammer, A. (2021). Seismic interpretation of the Cretaceous unconformities and sequences in the Middle Magdalena Valley and the western margin of the Eastern Cordillera, Colombia. Comptes Rendus. Géoscience, 353(1), 155-172. https://doi.org/10.5802/crgeos.47
Haq, B. U., Hardenbol, J., Vail, P. R., Stover, L. E., Colin, J. P., Ioannides, N. S., ... & Morgan, B. E. (1988). Mesozoic and Cenozoic chronostratigraphy and cycles of sea-level change. https://doi.org/10.2110/pec.88.01.0071
Hasbollah, D. Z. A., & Junin, R. (2017). Assessment of geological CO2 storage potential in central Luconia province. International Journal of Advanced and Applied Sciences, 4(2), 44-48. https://doi.org/10.21833/ijaas.2017.02.008
Hicks, N., Davids, S., Beck, B., & Green, A. (2014). Investigation of CO2 storage potential of the Durban Basin in South Africa. Energy Procedia, 63, 5200-5210. https://doi.org/10.1016/j.egypro.2014.11.551
Horton, B. K., Anderson, V. J., Caballero, V., Saylor, J. E., Nie, J., Parra, M., & Mora, A. (2015). Application of detrital zircon U-Pb geochronology to surface and subsurface correlations of provenance, paleodrainage, and tectonics of the Middle Magdalena Valley Basin of Colombia. Geosphere, 11(6), 1790-1811. https://doi.org/10.1130/GES01251.1
Horton, B. K., Parra, M., & Mora, A. (2020). Construction of the Eastern Cordillera of Colombia: Insights from the sedimentary record. The geology of Colombia, 3, ca-3. https://repositorio.usp.br/directbitstream/1e119c88-9a34-4eeb-bf2c-50c7b84727d1/3119630.pdf
Ibañez–Mejia, M., Gómez, J., & Mateus–Zabala, D. (2020). The Putumayo orogen of Amazonia: a synthesis. The geology of Colombia, Volume 1 Proterozoic-Paleozoic. https://www2.sgc.gov.co/LibroGeologiaColombia/tgc/sgcpubesp35201906.pdf
INGEOMINAS-UIS. (2006). Cartografía geológica de 9.600 km2 de la serranía de San Lucas: Planchas 55 (El Banco), 64 (Barranco de Loba), 85 (Simití) y 96 (Bocas del Rosario). Aporte a su evolución geológica. Memoria explicativa de la Plancha 96-Bocas del Rosario. https://miig.sgc.gov.co/Paginas/Resultados.aspx?k=230082105010024369000000000
International Energy Agency. CO2 Emissions in 2022. IEA Publications, 2023, 19. https://www.iea.org/reports/co2-emissions-in-2022
Javaid, A., Arshed, N., Munir, M., Amani Zakaria, Z., Alamri, F. S., Abd El-Wahed Khalifa, H., & Hanif, U. (2022). Econometric assessment of institutional quality in mitigating global climate-change risk. Sustainability, 14(2), 669. https://doi.org/10.3390/su14020669
Kozeny, J. (1927). Ueber kapillare leitung des wassers im boden. Sitzungsberichte der Akademie der Wissenschaften in Wien, 136, 271. https://cir.nii.ac.jp/crid/1370285708268135431.
La Croix, A., He, J., Wang, J., & Gonzalez, S. (2018). Geologically-realistic facies distribution in static reservoir models for CO2 sequestration: from core to wireline logs to grid cells. In 14th Greenhouse Gas Control Technologies Conference Melbourne (pp. 21-26). https://doi.org/10.2139/ssrn.3366017
López, E. (2004). Deep crust models of Colombia. República de Colombia. Ministerio de Minas y Energía. Instituto Colombiano de Geología y Minería. INGEOMINAS. Bogotá DC. 43p, 2. https://catalogo.sgc.gov.co/cgi-bin/koha/opac-detail.pl?biblionumber=48418
López-Ramos, E., Rincón-Martínez, D., Moreno, N., & Gómez, P. D. (2021). Mass balance of Neogene sediments in the Colombia Basin relationship with the evolution of the Magdalena and Cauca River basins. CT&F-Ciencia, Tecnología y Futuro, 11(1), 65-96. https://doi.org/10.29047/01225383.297
Ma, J., Li, L., Wang, H., Du, Y., Ma, J., Zhang, X., & Wang, Z. (2022). Carbon capture and storage: history and the road ahead. Engineering, 14, 33-43. https://doi.org/10.1016/j.eng.2021.11.024
Madero, H. D., Rueda, J. P., Ortiz, A., & Colegial, J. D. (2010). Análisis estratigráfico para las arenas de la Formacion Mugrosa en área piloto implicaciones paleogeográficas. Boletín de Geología, 32(1), 27-44. http://www.scielo.org.co/scielo.php?pid=S0120-02832010000100002&script=sci_arttext
Milesi, G., Monié, P., Münch, P., Soliva, R., Taillefer, A., Bruguier, O., ... & Martin, C. (2020). Tracking geothermal anomalies along a crustal fault using (U-Th)/He apatite thermochronology and rare-earth element (REE) analyses: The example of the Têt fault (Pyrenees, France). Solid Earth, 11(5), 1747-1771. https://doi.org/10.5194/se-11-1747-2020
Montes, C., Silva, C. A., Bayona, G. A., Villamil, R., Stiles, E., Rodriguez-Corcho, A. F., ... & von Quadt, A. (2021). A middle to late Miocene trans-Andean portal: Geologic record in the Tatacoa Desert. Frontiers in Earth Science, 8, 587022. https://doi.org/10.3389/feart.2020.587022
Mora, A., Reyes-Harker, A., Rodriguez, G., Tesón, E., Ramirez-Arias, J. C., Parra, M., ... & Stockli, D. F. (2013). Inversion tectonics under increasing rates of shortening and sedimentation: Cenozoic example from the Eastern Cordillera of Colombia. https://doi.org/10.1144/SP377.17
Morales, L. G. (1958). General geology and oil occurrences of Middle Magdalena Valley, Colombia. https://catalogo.sgc.gov.co/cgi-bin/koha/opac-detail.pl?biblionumber=72133
Moreno, G. (2019). Mapa geológico del cañón del río Sogamoso, en el sector Villanueva, Zapatoca, Betulia, departamento de Santander. In F. Etayo-Serna (Ed.), Estudios geológicos y paleontológicos sobre el Cretácico en la región del embalse del río Sogamoso, Valle Medio del Magdalena (pp. 391–412). Servicio Geológico Colombiano. https://docslib.org/download/5838191/mapa-geol%C3%B3gico-del-ca%C3%B1%C3%B3n-del-r%C3%ADo-sogamoso-en-el-sector-villanueva-zapatoca-betulia-departamento-de-santander-mapa-geol%C3%B3
Nakanishi, S., Mizuno, Y., Okumura, T., Miida, H., Shidahara, T., & Hiramatsu, S. I. (2009). Methodology of CO2 aquifer storage capacity assessment in Japan and overview of the project. Energy Procedia, 1(1), 2639-2646. https://doi.org/10.1016/j.egypro.2009.02.031
National Energy Technology Laboratory (NETL), & United States Department of Energy (USDOE). (2015). Carbon storage atlas (5th ed.). https://edx.netl.doe.gov/dataset/netl-carbon-storage-atlas-fifth-edition/resource/4f44abdf-0976-4251-8838-457c60e638ba
NETL;USDOE (2007)., Carbon Sequestration Atlas of the United States and Canada. Albany: USDOE. https://doi.org/10.1016/j.earscirev.2011.11.002
NETL (US), & United States. Office of Fossil Energy. (2008). Carbon sequestration atlas of the United States and Canada. National Energy Technology Laboratory. https://books.google.com/books?hl=es&lr=&id=TYsJ04mY6ogC&oi=fnd&pg=PA4&dq=USDOE,+OFE,+NETL.+%E2%80%9CCarbon+Sequestration+Atlas+of+the+United+State+and+Canada.%E2%80%9D+2008,+90.&ots=IqJy8mj3Wh&sig=fBtL1164cJU-HeIzXk8_TMAAqLQ
Nie, J., Horton, B. K., Saylor, J. E., Mora, A., Mange, M., Garzione, C. N., ... & Parra, M. (2012). Integrated provenance analysis of a convergent retroarc foreland system: U–Pb ages, heavy minerals, Nd isotopes, and sandstone compositions of the Middle Magdalena Valley basin, northern Andes, Colombia. Earth-Science Reviews, 110(1-4), 111-126. https://www.sciencedirect.com/science/article/pii/S0012825211001656 https://doi.org/10.1016/j.earscirev.2011.11.002
OECD/IEA. (2015). Storing CO2 through Enhanced Oil Recovery. Paris: IEA. https://www.iea.org/reports/storing-co2-through-enhanced-oil-recovery
Pastor-Chacón, A., Aguilera, R., Triana, J. L., Paez-Reyes, M., Cantisano, M., Bravo, L., ... & Fuenzalida, H. (2023). Sweet spot areas for shale oil and shale gas plays in the Upper Cretaceous rocks of the Middle Magdalena Valley, Colombia: insights from basin modeling. Frontiers in Earth Science, 11, 1146126.. https://doi.org/10.3389/feart.2023.1146126
Piraquive, A., Kammer, A., Gómez, C., Bernet, M., Muñoz-Rocha, J. A., Quintero, C. A., ... & Peña-Urueña, M. L. (2021). Middle-late Triassic metamorphism of the Guajira Arch-basement: Insights from zircon U–Pb and Lu–Hf systematics. Journal of South American Earth Sciences, 110, 103397. https://doi.org/10.1016/j.jsames.2021.103397
Restrepo-Pace, P. A., & Cediel, F. (2010). Northern South America basement tectonics and implications for paleocontinental reconstructions of the Americas. Journal of South American Earth Sciences, 29(4), 764-771. https://doi.org/10.1016/j.jsames.2010.06.002
Reyes, M., Kley, J., Mora, A., Bello-Palacios, D., Vargas, A. F., Carvajal-Torres, J., & Osorno, J. (2022). La Cira Basement-high; Middle Magdalena Valley Basin, Colombia. In Andean Structural Styles (pp. 207-219). Elsevier. https://doi.org/10.1016/B978-0-323-85175-6.00015-8
Rode, D. C., Anderson, J. J., Zhai, H., & Fischbeck, P. S. (2023). Six principles to guide large-scale carbon capture and storage development. Energy Research & Social Science, 103, 103214. https://doi.org/10.1016/j.erss.2023.103214
Rodríguez-García, G., Correa-Martínez, A. M., Zapata-Villada, J. P., & Obando-Erazo, G. (2019). Fragments of a Permian arc on the western margin of the Neoproterozoic basement of Colombia. The geology of Colombia, 1(Chapter 10). https://www.researchgate.net/profile/Gabriel-Garcia-4/publication/336068226_Fragments_of_a_Permian_Arc_on_the_Western_Margin_of_the_Neoproterozoic_Basement_of_Colombia/links/5d8cb6df458515202b6a41f5/Fragments-of-a-Permian-Arc-on-the-Western-Margin-of-the-Neoproterozoic-Basement-of-Colombia.pdf
Rolon, L. F. (2004). Structural geometry of the Jura-Cretaceous rift of the Middle Magdalena Valley basin, Colombia. West Virginia University. https://search.proquest.com/openview/d2da18f457685ef5eb3d9415694e5513/1?pq-origsite=gscholar&cbl=18750&diss=y
Rutqvist, J., Wu, Y. S., Tsang, C. F., & Bodvarsson, G. (2002). A modeling approach for analysis of coupled multiphase fluid flow, heat transfer, and deformation in fractured porous rock. International Journal of Rock Mechanics and Mining Sciences, 39(4), 429-442. https://doi.org/10.1016/S1365-1609(02)00022-9
Rojas, L. S. (2002). Mesozoic rifting and Cenozoic basin inversion-History of the Eastern Cordilelra, Combian Andes. Inferences from tectonic models. https://research.vu.nl/en/publications/mesozoic-rifting-and-cenozoic-basin-inversion-history-of-the-east
Sheldon, H. A., Crombez, V., Poulet, T., Kelka, U., Kunzmann, M., & Kerrison, E. (2023). Realistic permeability distributions in faults and sediments: The key to predicting fluid flow in sedimentary basins. Basin Research, 35(6), 2118-2139. https://doi.org/10.1111/bre.12792
Silva, A., Mora, A., Caballero, V., Rodriguez, G., Ruiz, C., Moreno, N., ... & Quintero, I. (2013). Basin compartmentalization and drainage evolution during rift inversion: evidence from the Eastern Cordillera of Colombia. https://pubs.geoscienceworld.org/books/edited-volume/1859/chapter/107622195 https://doi.org/10.1144/SP377.15
Suárez Rueda, C. O. (2016). Arenas basales del Cretáceo inferior, potencial roca hidrocarburífera en la región central de la cuenca del Valle Medio del Magdalena, Colombia. Geología. https://repositorio.unal.edu.co/handle/unal/56512
Sun, L., Dou, H., Li, Z., Hu, Y., & Hao, X. (2018). Assessment of CO2 storage potential and carbon capture, utilization and storage prospect in China. Journal of the energy institute, 91(6), 970-977. https://doi.org/10.1016/j.joei.2017.08.002
Tasianas, A., & Koukouzas, N. (2016). CO2 storage capacity estimate in the lithology of the Mesohellenic Trough, Greece. Energy Procedia, 86, 334-341.https://doi.org/10.1016/j.egypro.2016.01.034
Vangkilde-Pedersen, T., K. L. Anthosen, and et al. (2009). "Assessing European capacity for geologial storage of carbon dioxide - the UE GeoCapacity project." Energy Procedia, 2663-2670. https://www.sciencedirect.com/science/article/pii/S1876610209006778 https://doi.org/10.1016/j.egypro.2009.02.034
Vargas Vargas, M. L. (2022). Geometría y evolución de la Falla Casabe en el Valle Medio del Magdalena, Colombia [Tesis doctoral, Universidad Nacional de Colombia]. https://repositorio.unal.edu.co/handle/unal/80847
Vásquez Parra, M. F. (2007). Mafic magmatism in the Eastern Cordillera and Putumayo Basin, Colombia: causes and consequences (Doctoral dissertation, Universität Potsdam). https://publishup.uni-potsdam.de/frontdoor/index/index/docId/1192
Villamil, T. (1998). Chronology, relative sea-level history and a new sequence stratigraphic model for basinal Cretaceous facies of Colombia. https://doi.org/10.2110/pec.98.58.0161
Xie, J., Zhang, K., Li, C., & Wang, Y. (2016). Preliminary study on the CO2 injectivity and storage capacity of low-permeability saline aquifers at Chenjiacun site in the Ordos Basin. International Journal of Greenhouse Gas Control, 52, 215-230. https://doi.org/10.1016/j.ijggc.2016.07.016
Yáñez, E., Ramírez, A., Núñez-López, V., Castillo, E., & Faaij, A. (2020). Exploring the potential of carbon capture and storage-enhanced oil recovery as a mitigation strategy in the Colombian oil industry. International Journal of Greenhouse Gas Control, 94, 102938. https://doi.org/10.1016/j.ijggc.2019.102938
Zuluaga, C. A., Pinilla, A., & Mann, P. (2015). Jurassic silicic volcanism and associated Continental-arc Basin in northwestern Colombia (southern boundary of the Caribbean plate). https://pubs.geoscienceworld.org/aapg/books/edited-volume/1509/chapter/107191661 https://doi.org/10.1306/13531934M1083640
AUTHORS
Eduardo López-Ramos
Affiliation: ECOPETROL, Gerencia Centro Técnico de Desarrollo, Bogotá, Colombia
ORCID: 0000-0001-7836-470X
e-mail: Eduardo.lopezra@ecopetrol.com.co
Helber Cubillos Gutierrez
Affiliation: ECOPETROL, Gerencia Centro Técnico de Desarrollo, Bogotá, Colombia
ORCID: 0009-0006-1486-5648
e-mail: helber.cubillos@ecopetrol.com.co
Felipe Medellín
Affiliation: Halliburton. Houston, TX, USA
ORCID: 0009-0004-1267-1415
e-mail: Felipe.Medellin@halliburton.com
Alcide Thebault
Affiliation: Beicip, IFP. Houston, TX, USA
ORCID: 0009-0000-6769-0673
e-mail: alcide.thebault@beicip.com